The Honest Odds: What 36 Million Posts Say About Your Carousel
The Honest Odds: What 36 Million Posts Say About Your Carousel
If your last carousel got four likes and you felt a bit embarrassed about it, here is some context: that is double the typical Instagram post.
Most advice about social media comes from people with large followings, describing what worked for them. That is survivorship bias with a ring light. What you rarely see is the full distribution — every post, including the ones nobody talks about.
Two large datasets published this year come close. Zernio, a social media API company, analyzed 36.06 million posts with synced analytics from the accounts connected to its platform and published the methodology, sample sizes and bias disclosures alongside the numbers. Buffer published its State of Social Media Engagement 2026 report, built on more than 52 million posts published through its scheduler.
Both are vendor data, drawn from their own customers, and both say so. Neither is a full view of any platform. But they measure medians instead of averages, and that alone makes them more honest than most of what gets quoted. Here is what they say about your odds, including the parts that don’t flatter carousels.
The Baseline Nobody Publishes
Start with Zernio’s headline numbers, because they reset expectations fast:
- The median Instagram post gets 2 likes.
- The median LinkedIn, X and Threads post gets zero.
- 35% of Instagram posts get no likes at all. On X it is 76%. On LinkedIn, roughly half. TikTok is the kindest at 18%.
The accounts behind those posts are small. In Zernio’s sample, the median Instagram account has 108 followers and the median TikTok account has 156. Zernio describes its users as creators, small businesses and developers rather than celebrities, which is exactly why these numbers look like your numbers and not like a benchmark report.
Why averages lie to you
The same dataset shows why industry “average engagement” figures feel impossible. The top 1% of posts capture between 78% and 90% of all likes on every major platform Zernio measured. The average Instagram post in its data gets 341 likes. The median gets 2.
An average that high is not describing a typical post. It is describing a handful of viral outliers, smeared across everyone else. If you have been measuring your carousels against a benchmark built on averages, you have been comparing yourself to the top of a pyramid.
Buffer made the same choice for the same reason. Its methodology says it defaults to medians because “social performance distributions are heavily skewed.” When two independent datasets both refuse to use averages, take the hint.
Posting Time Is a Rounding Error
“Post at the right time” is probably the most repeated piece of social media advice there is. Zernio tested it against a full year of posts, split by publishing hour and day of week.
The lines came out nearly flat. On Instagram, 75th-percentile likes ranged from 5 to 9.5 across all 24 hours of the day. By day of week, the same figure sat between 5 and 7. Meanwhile, the gap between a median post (2 likes) and a top-1% post (3,000+) is more than 1,500x.
Zernio is upfront about the caveat: its timestamps are in UTC across a global user base, which flattens per-timezone peaks somewhat. But an effect small enough to disappear when time zones are mixed was never going to be the thing that makes or breaks a post.
Buffer reaches a similar conclusion from a different angle. Its report calls timing and frequency “amplifiers” rather than drivers and says there is no single best time to post that works across platforms, niches and account sizes.
That doesn’t mean a schedule is useless. Our own 30-day carousel content calendar suggests posting windows, and a consistent slot is still a good habit because it makes publishing routine. Just don’t expect the hour to be the lever. Pick a time you can keep and stop testing it.
The Two Levers That Actually Move
If timing barely matters, what does? Both datasets point at the same two things.
Lever one: volume
In Zernio’s cadence analysis on Instagram, per-post engagement stayed roughly flat from posting weekly up to posting twice a day. More posts did not make each post worse. But the chance of landing a post with 100+ likes rose from 6% to 41% between the least and most frequent posting groups, and total engagement over 90 days scaled around 150x.
Zernio adds an honest disclosure: accounts that post daily may simply be better at this than accounts that post monthly. The flat per-post median is the strong signal. The rest should be read as odds, not a promise.
Buffer found something compatible from a different angle. Across 4.8 million channel-week observations, accounts that didn’t post in a given week consistently underperformed their own baseline growth. Any posting was better than none.
Put simply: when most of the rewards go to a few posts and you can’t reliably predict which ones, the rational move is more attempts. A carousel matters here because it is one of the cheapest formats to produce repeatedly. A recurring series — the same layout, a new subject each week — turns volume from an effort into a routine.
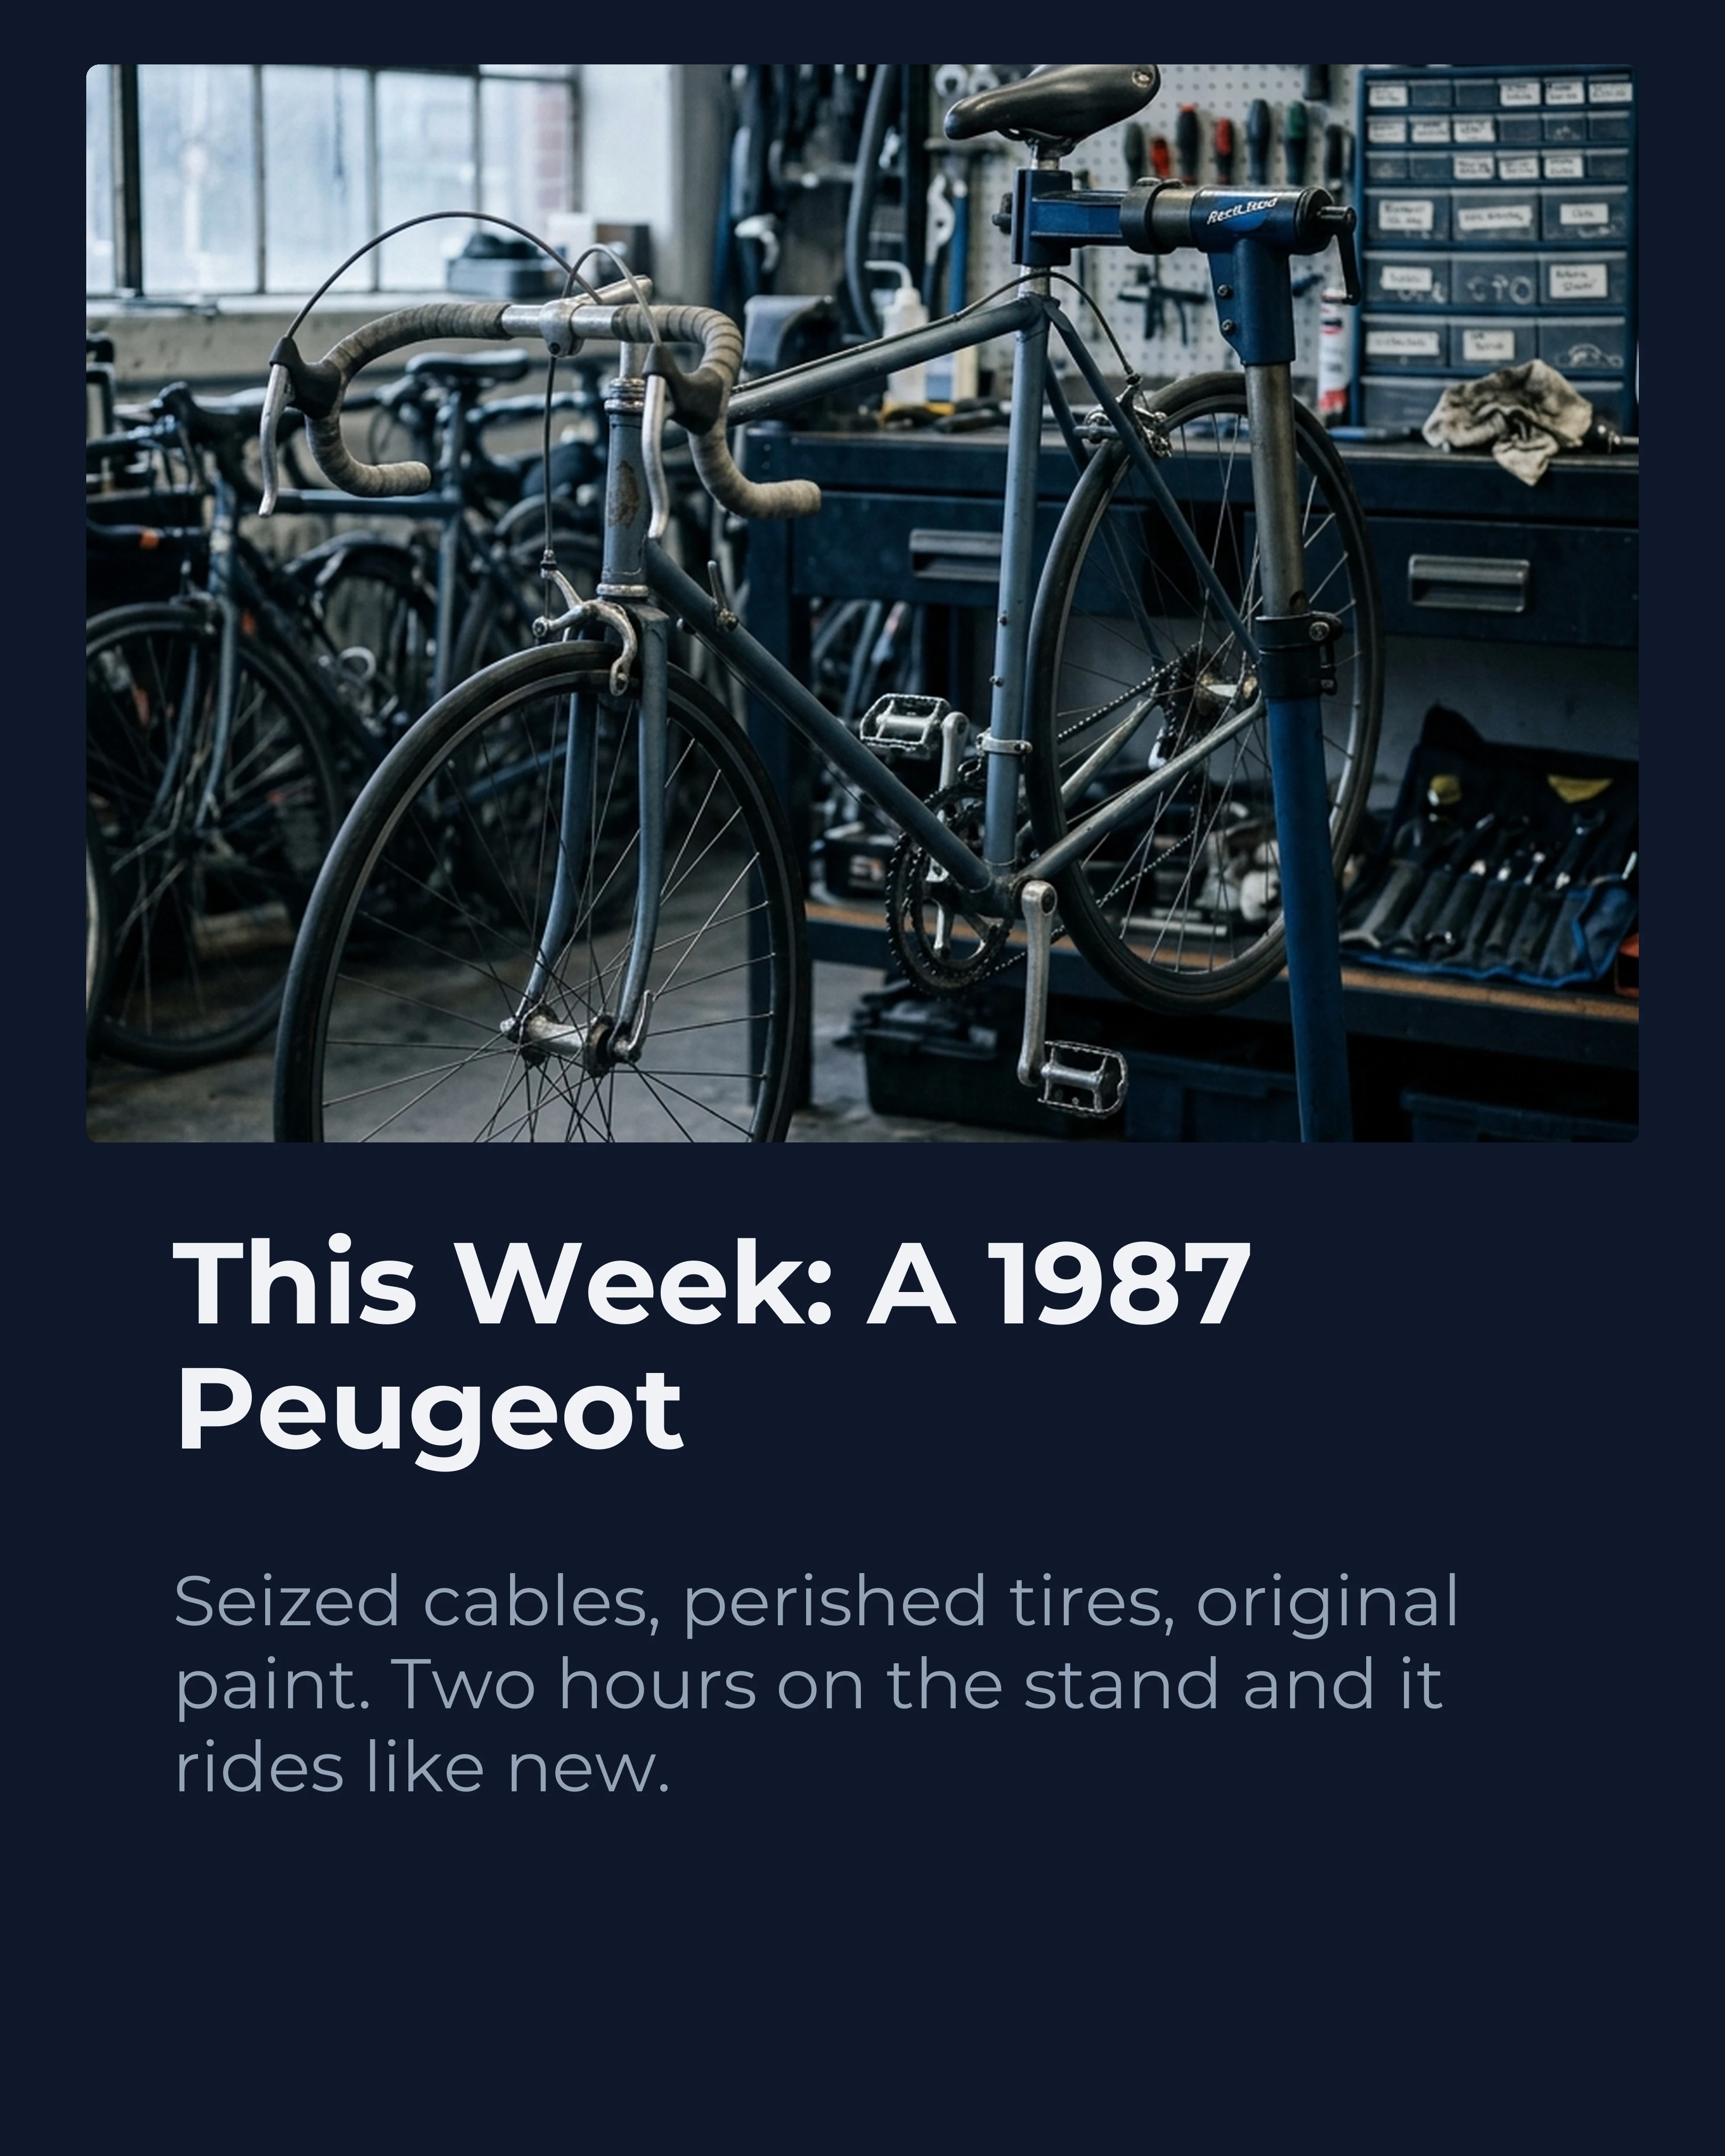
Here is a representative slide from the kind of weekly series a small bike repair shop might run. One photo from the workshop, two lines of copy, done in ten minutes:
Lever two: format — and this is where it gets uncomfortable
Zernio calls format “the only lever in our data with a big, reliable, boring multiplier.” The problem for anyone who loves carousels is which format it is talking about.
On Instagram, the median Reel in Zernio’s data gets 4 likes and 160 views. The median non-Reel post — which includes carousels — gets 1 like and 48 views. That is a 3-4x gap at the median, not just among viral outliers. Reels have also grown from 28% of Instagram posts in early 2025 to 59% at the time of the report.
Buffer’s numbers are more nuanced but point the same way on reach: Reels get 36% more reach than carousels on Instagram. The same report adds that carousels earn 12% more engagement than Reels, and part of that split comes from how engagement rate is calculated — Reels are optimized for views, which dilutes their per-view engagement.
So the honest summary is this: if all you want is the most views per post on Instagram, video is the better bet. Anyone telling you carousels beat Reels on reach is not reading the same data we are. We covered the reach-versus-engagement tradeoff in more depth in carousels vs Reels.
Where Carousels Still Win
A carousel isn’t the right tool for every job. It is the right tool for several specific ones.
Engagement from the people who do see it. Buffer’s 12% engagement edge on Instagram means the people a carousel reaches interact with it more. For a small account, a smaller audience that engages can matter more than a bigger one that scrolls past.
LinkedIn. Buffer found LinkedIn carousels (document posts) earn a median engagement rate of 21.77%, roughly three times video and images. Even a below-average carousel performs about as well as a typical video or image post there. That is Buffer’s own metric — LinkedIn counts clicks in engagement, and Buffer notes its numbers reflect its users only — but it is the clearest format win for carousels in either dataset.
Scarcity. In a 24,000-post sample of published posts, Zernio found 63% were video, 27% single images, 6% text-only and just 3% carousels. Whatever the format’s odds, you are competing with far fewer posts that look like yours.
Cost. This is the one that connects the two levers. A carousel can be made from photos you already have, in a template you have already set up, in less time than a well-edited Reel. If volume is the lever, the format you can actually produce every week beats the format you manage once a month.
Keeping power. Carousels suit reference content: checklists, step-by-step guides, the kind of post people want to come back to. Operators who publish carousels at volume regularly report that this content keeps resurfacing through search and profile visits for weeks. We don’t have a dataset that measures that, so treat it as a practitioner observation rather than a statistic, but it is consistent with what carousels are good at.
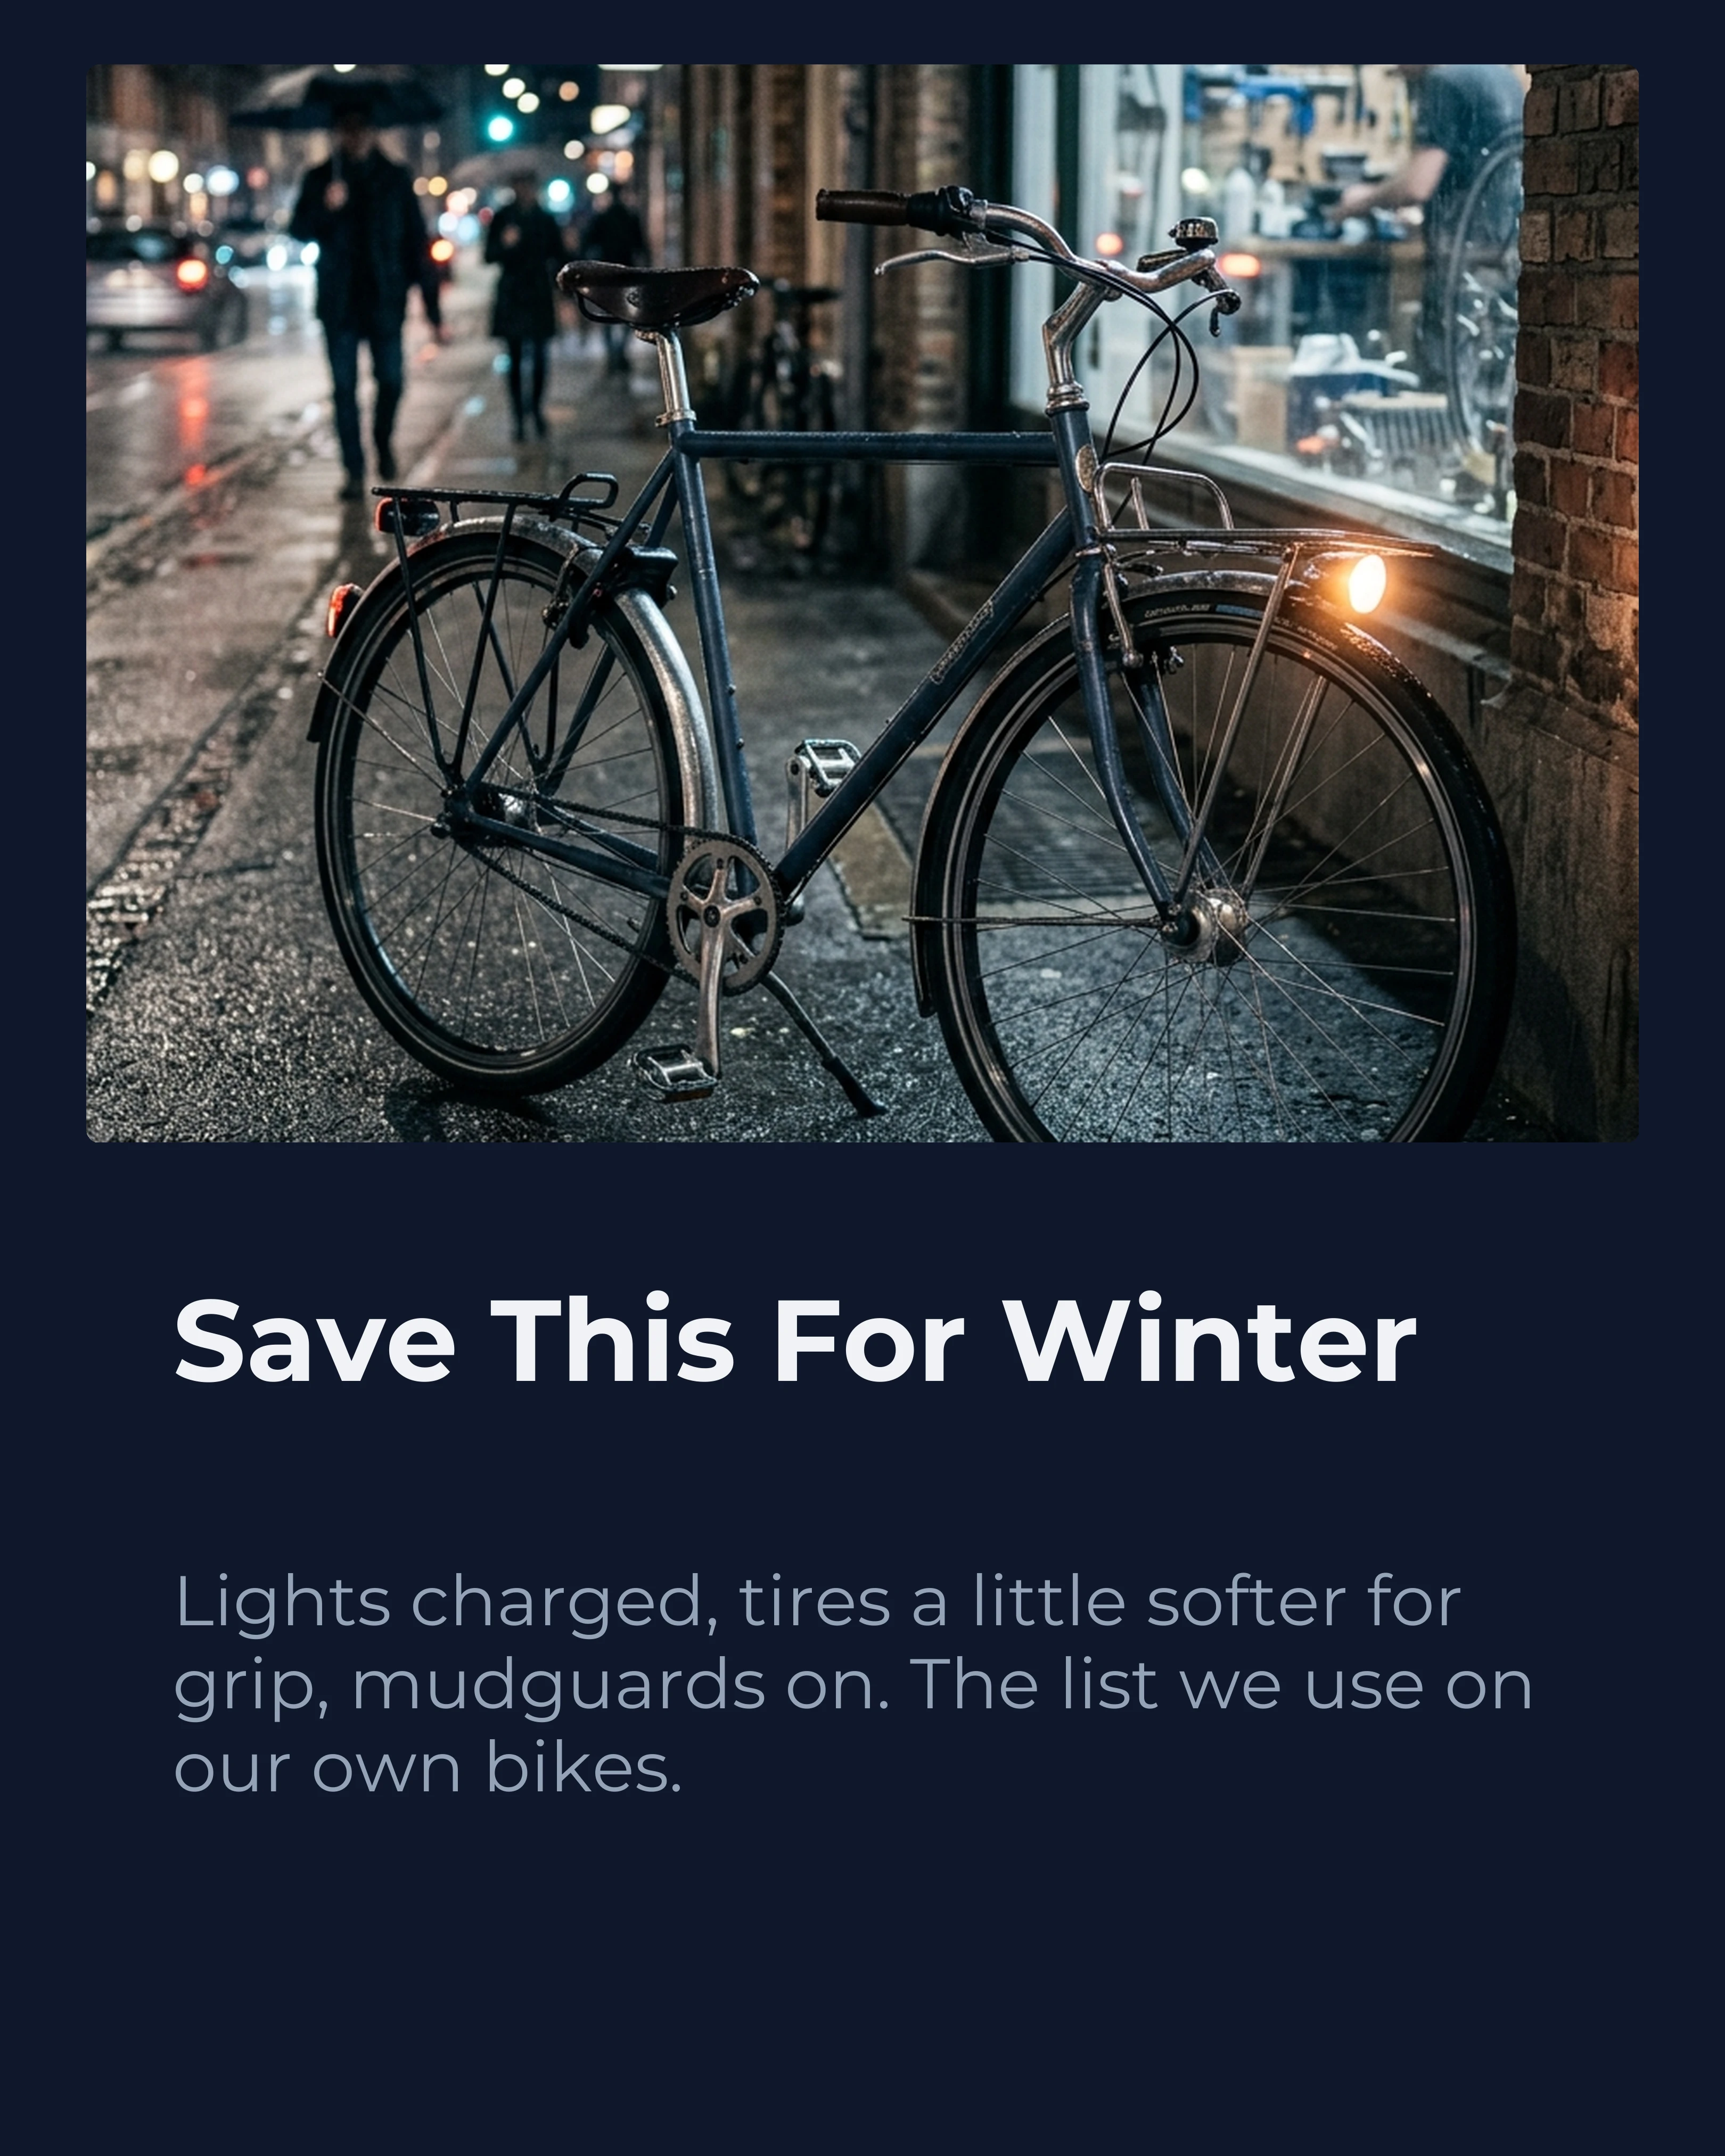
A representative “keep this” slide from the same bike shop — a post designed to be saved rather than scrolled past:
A Carousel Built for These Odds
Put the data together and a carousel that plays the real odds looks like this: evergreen rather than time-sensitive, so it can be reposted and cross-posted without going stale; useful enough to save; cheap enough to make every week; and indifferent to the hour it goes out.
Below is the full nine-slide version from the same bike shop: a chain-care guide for its customers. Cover with an open loop, one idea per slide in the order a rider would actually do them, and a single ask at the end on a different template and palette so it doesn’t read as one more tip. It is written for cyclists, not marketers, and nothing about it expires.
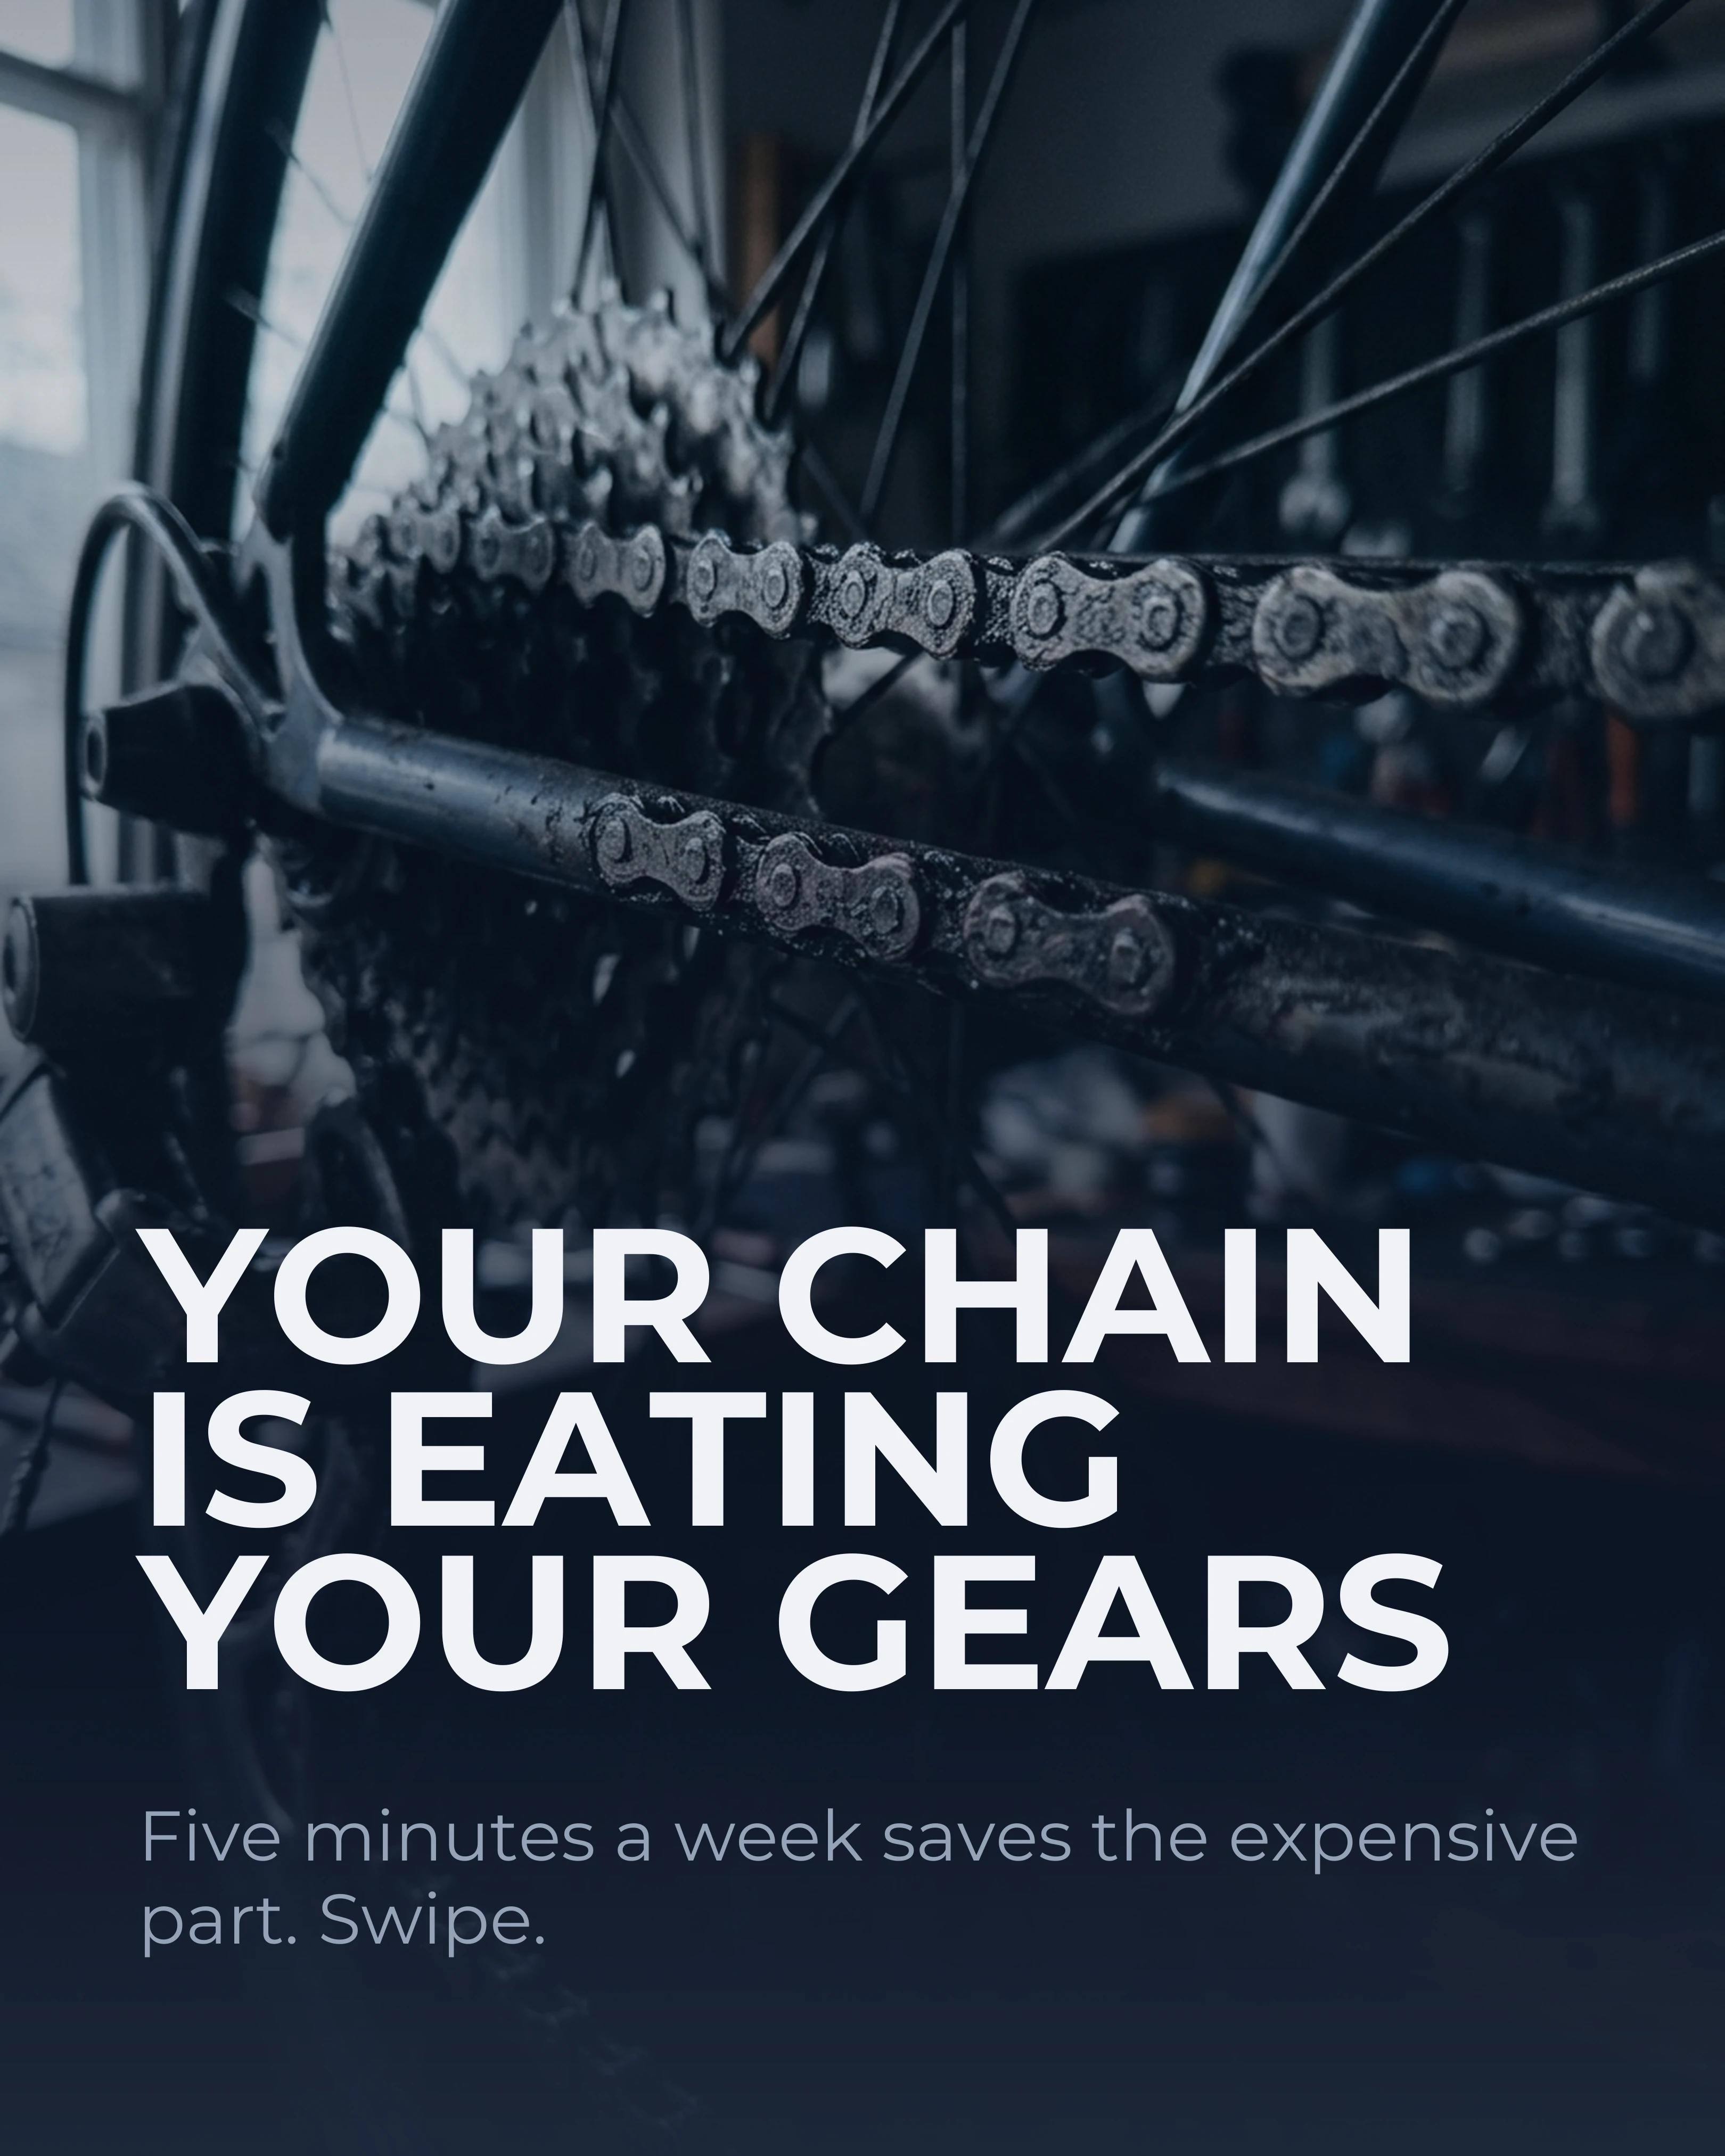
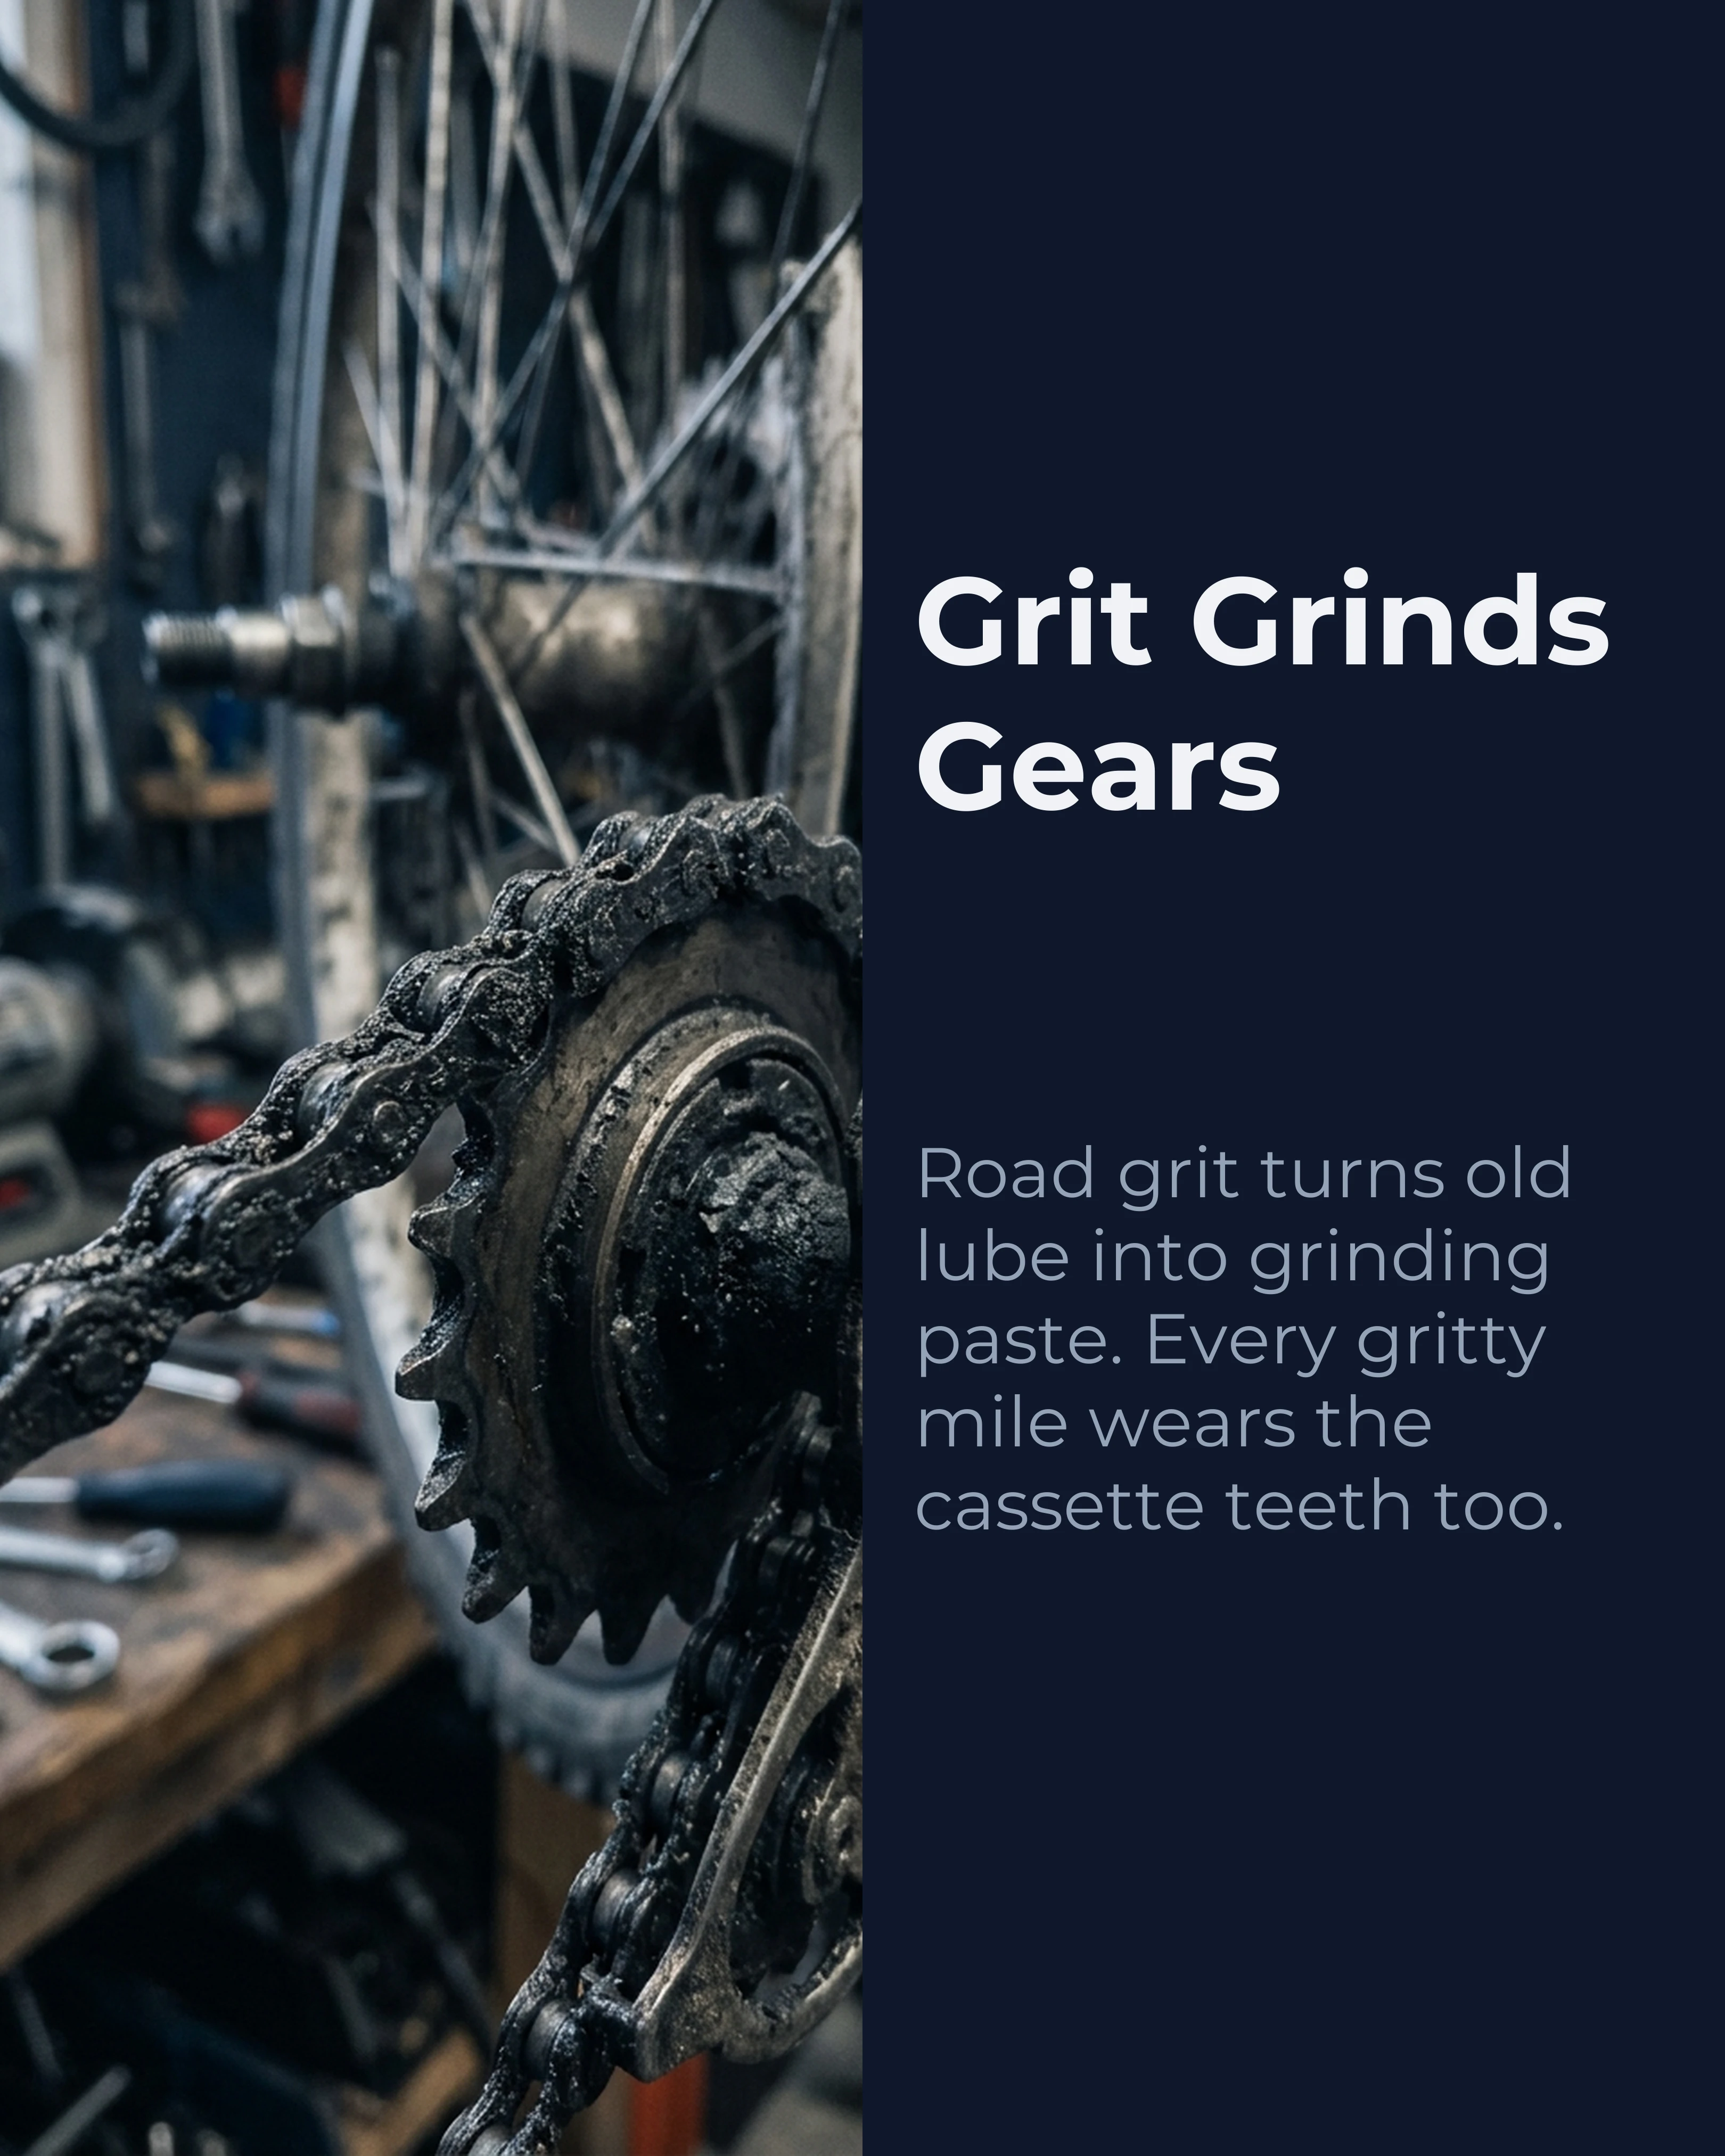
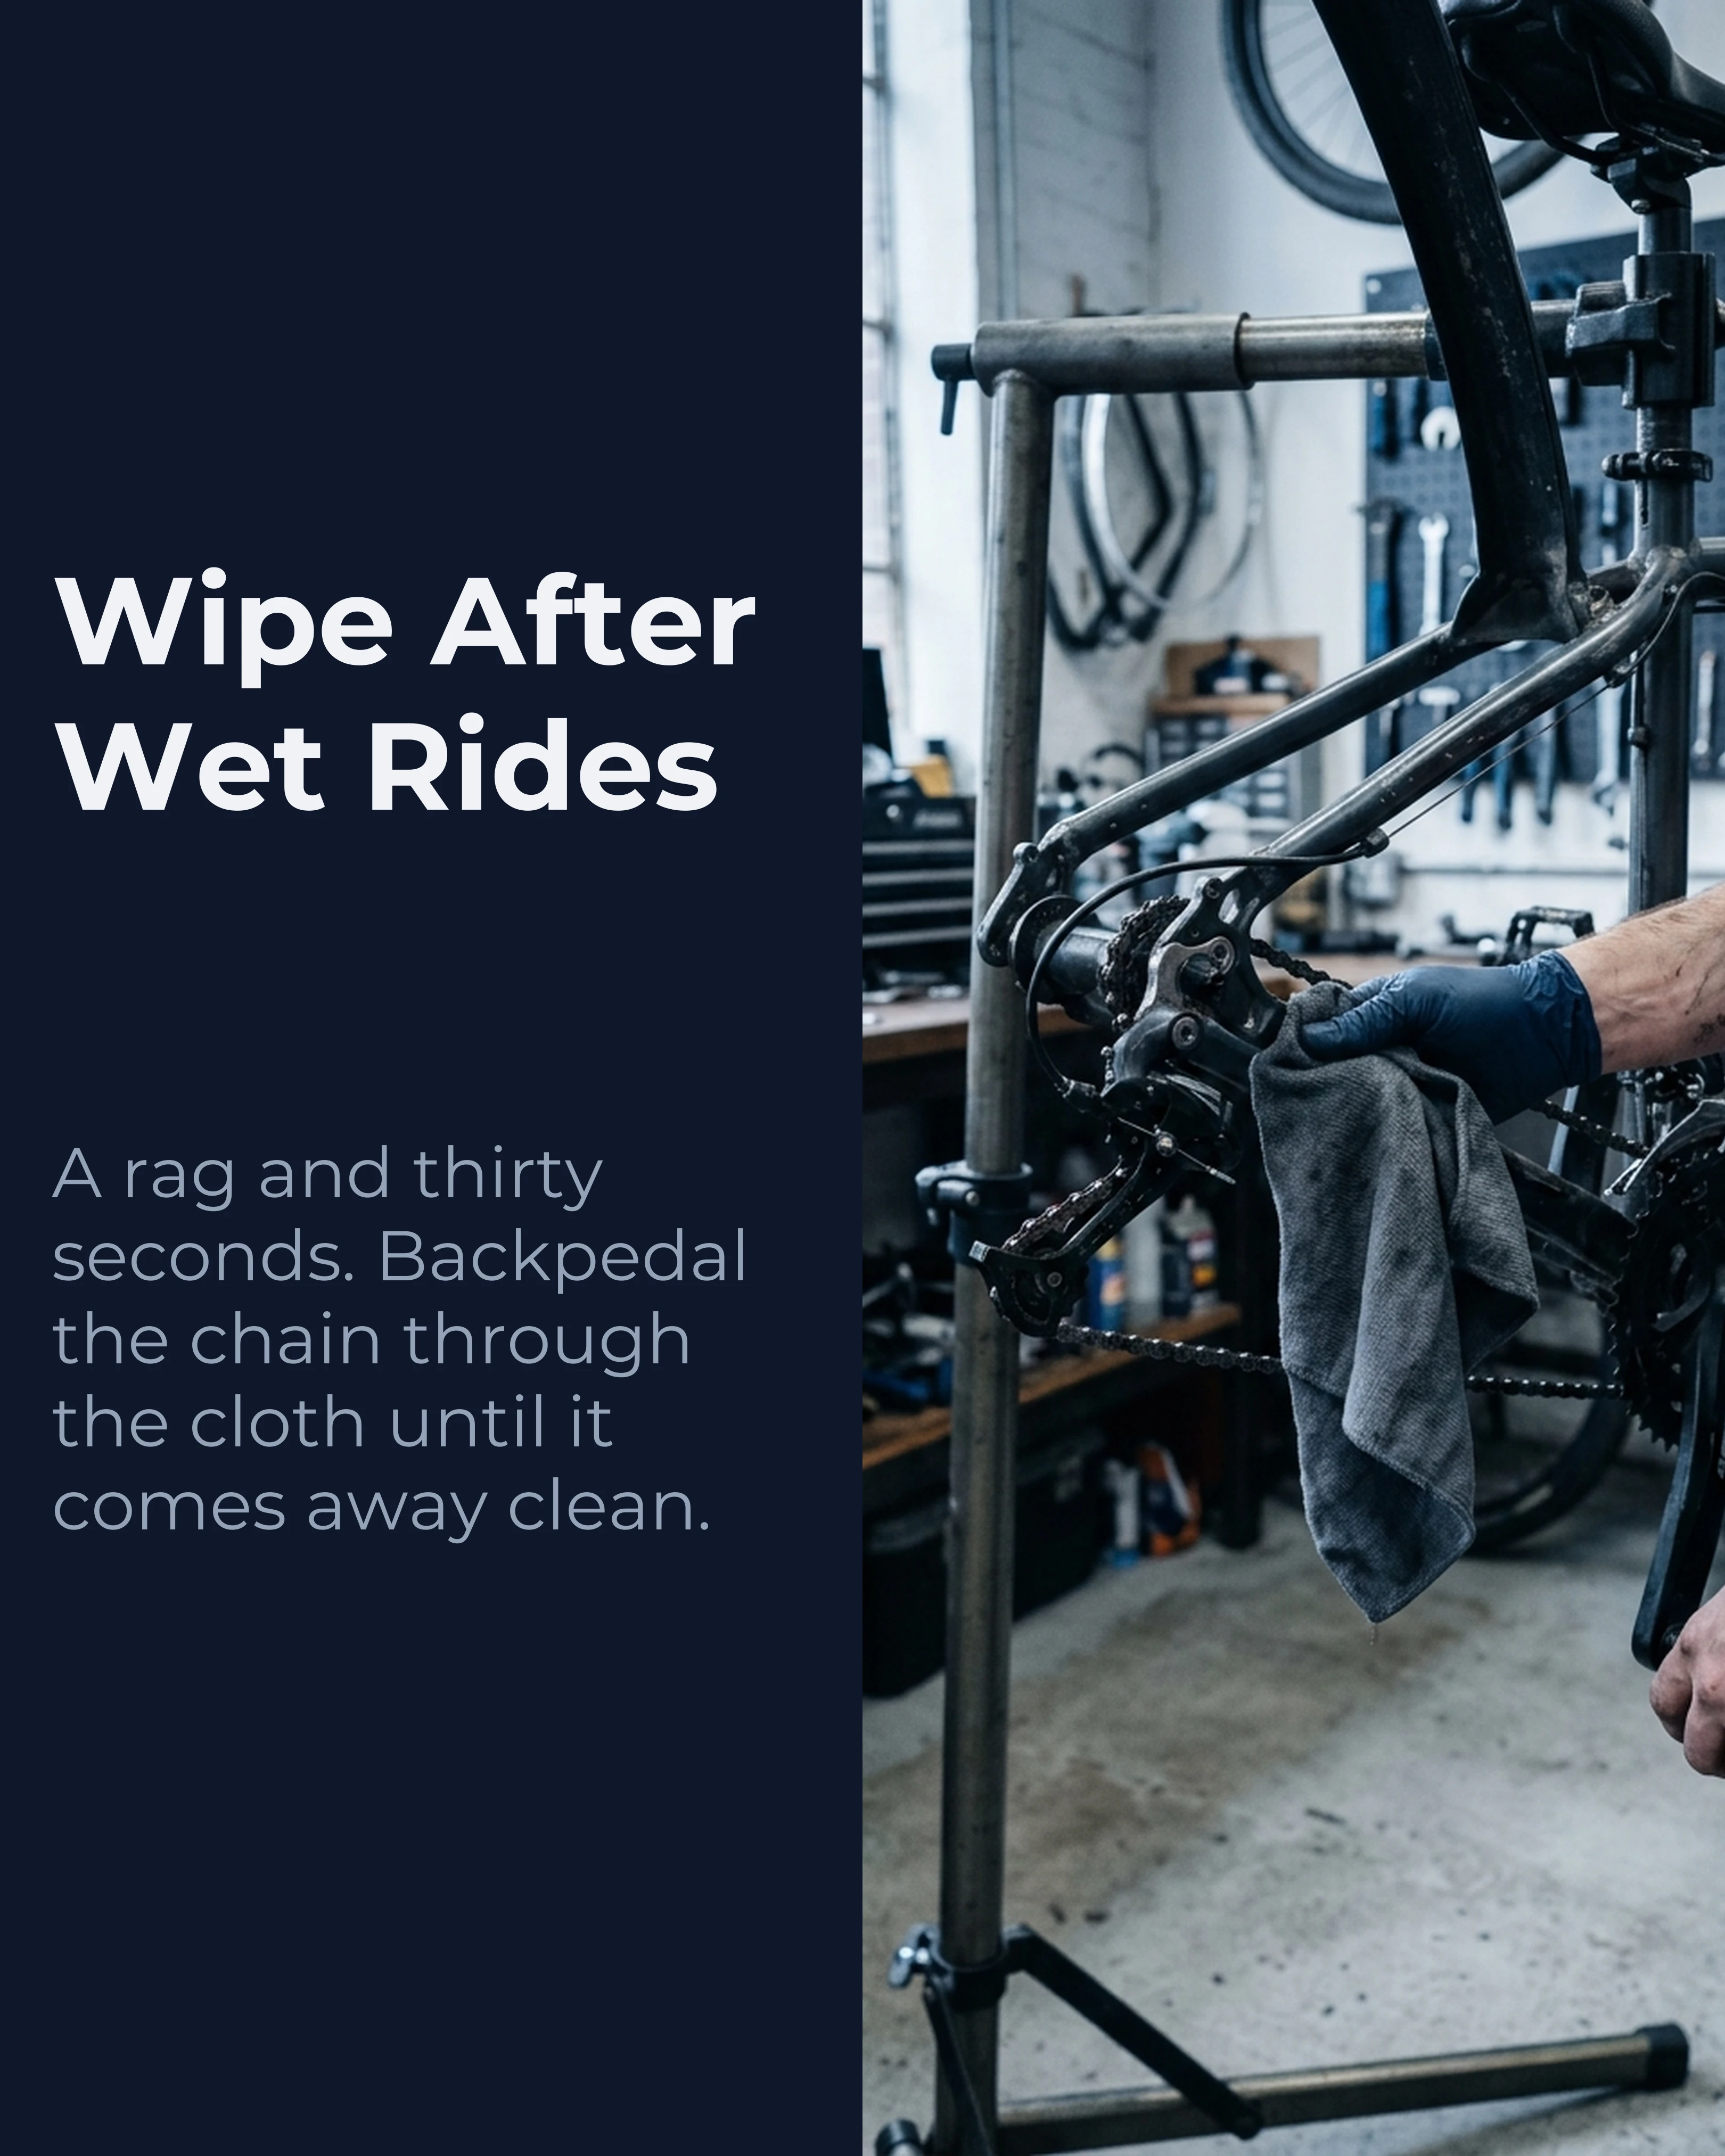
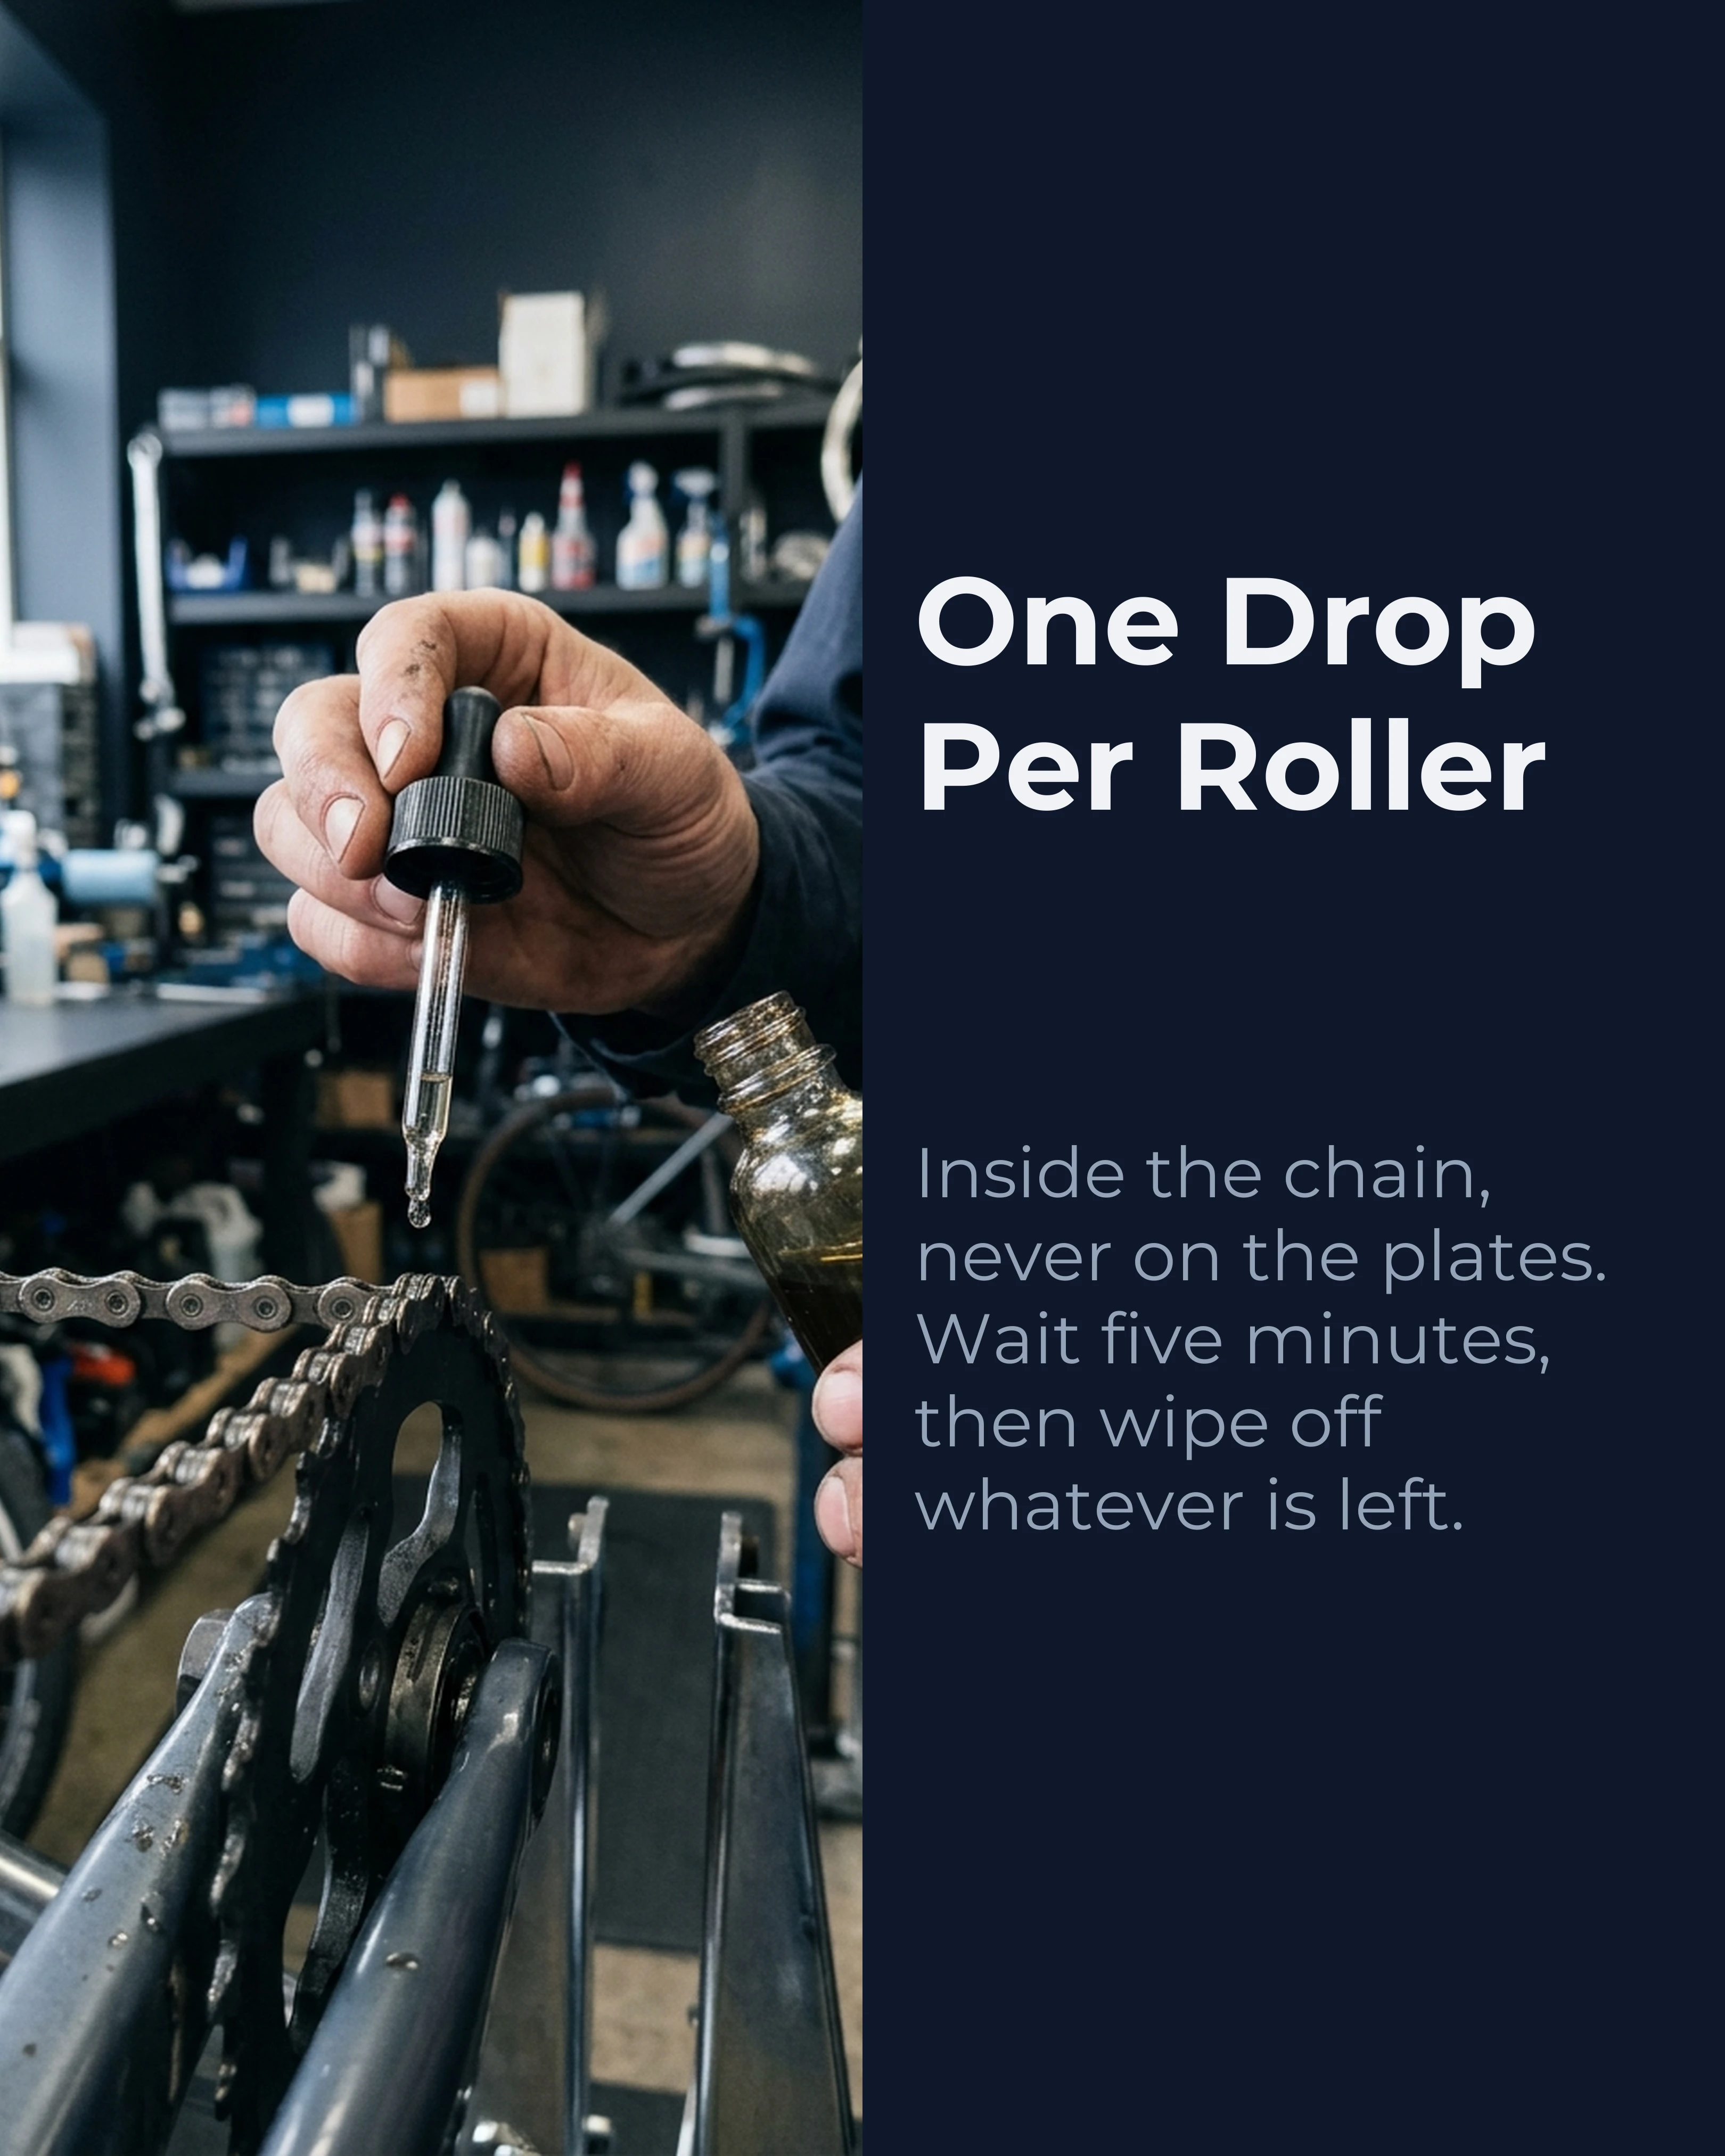
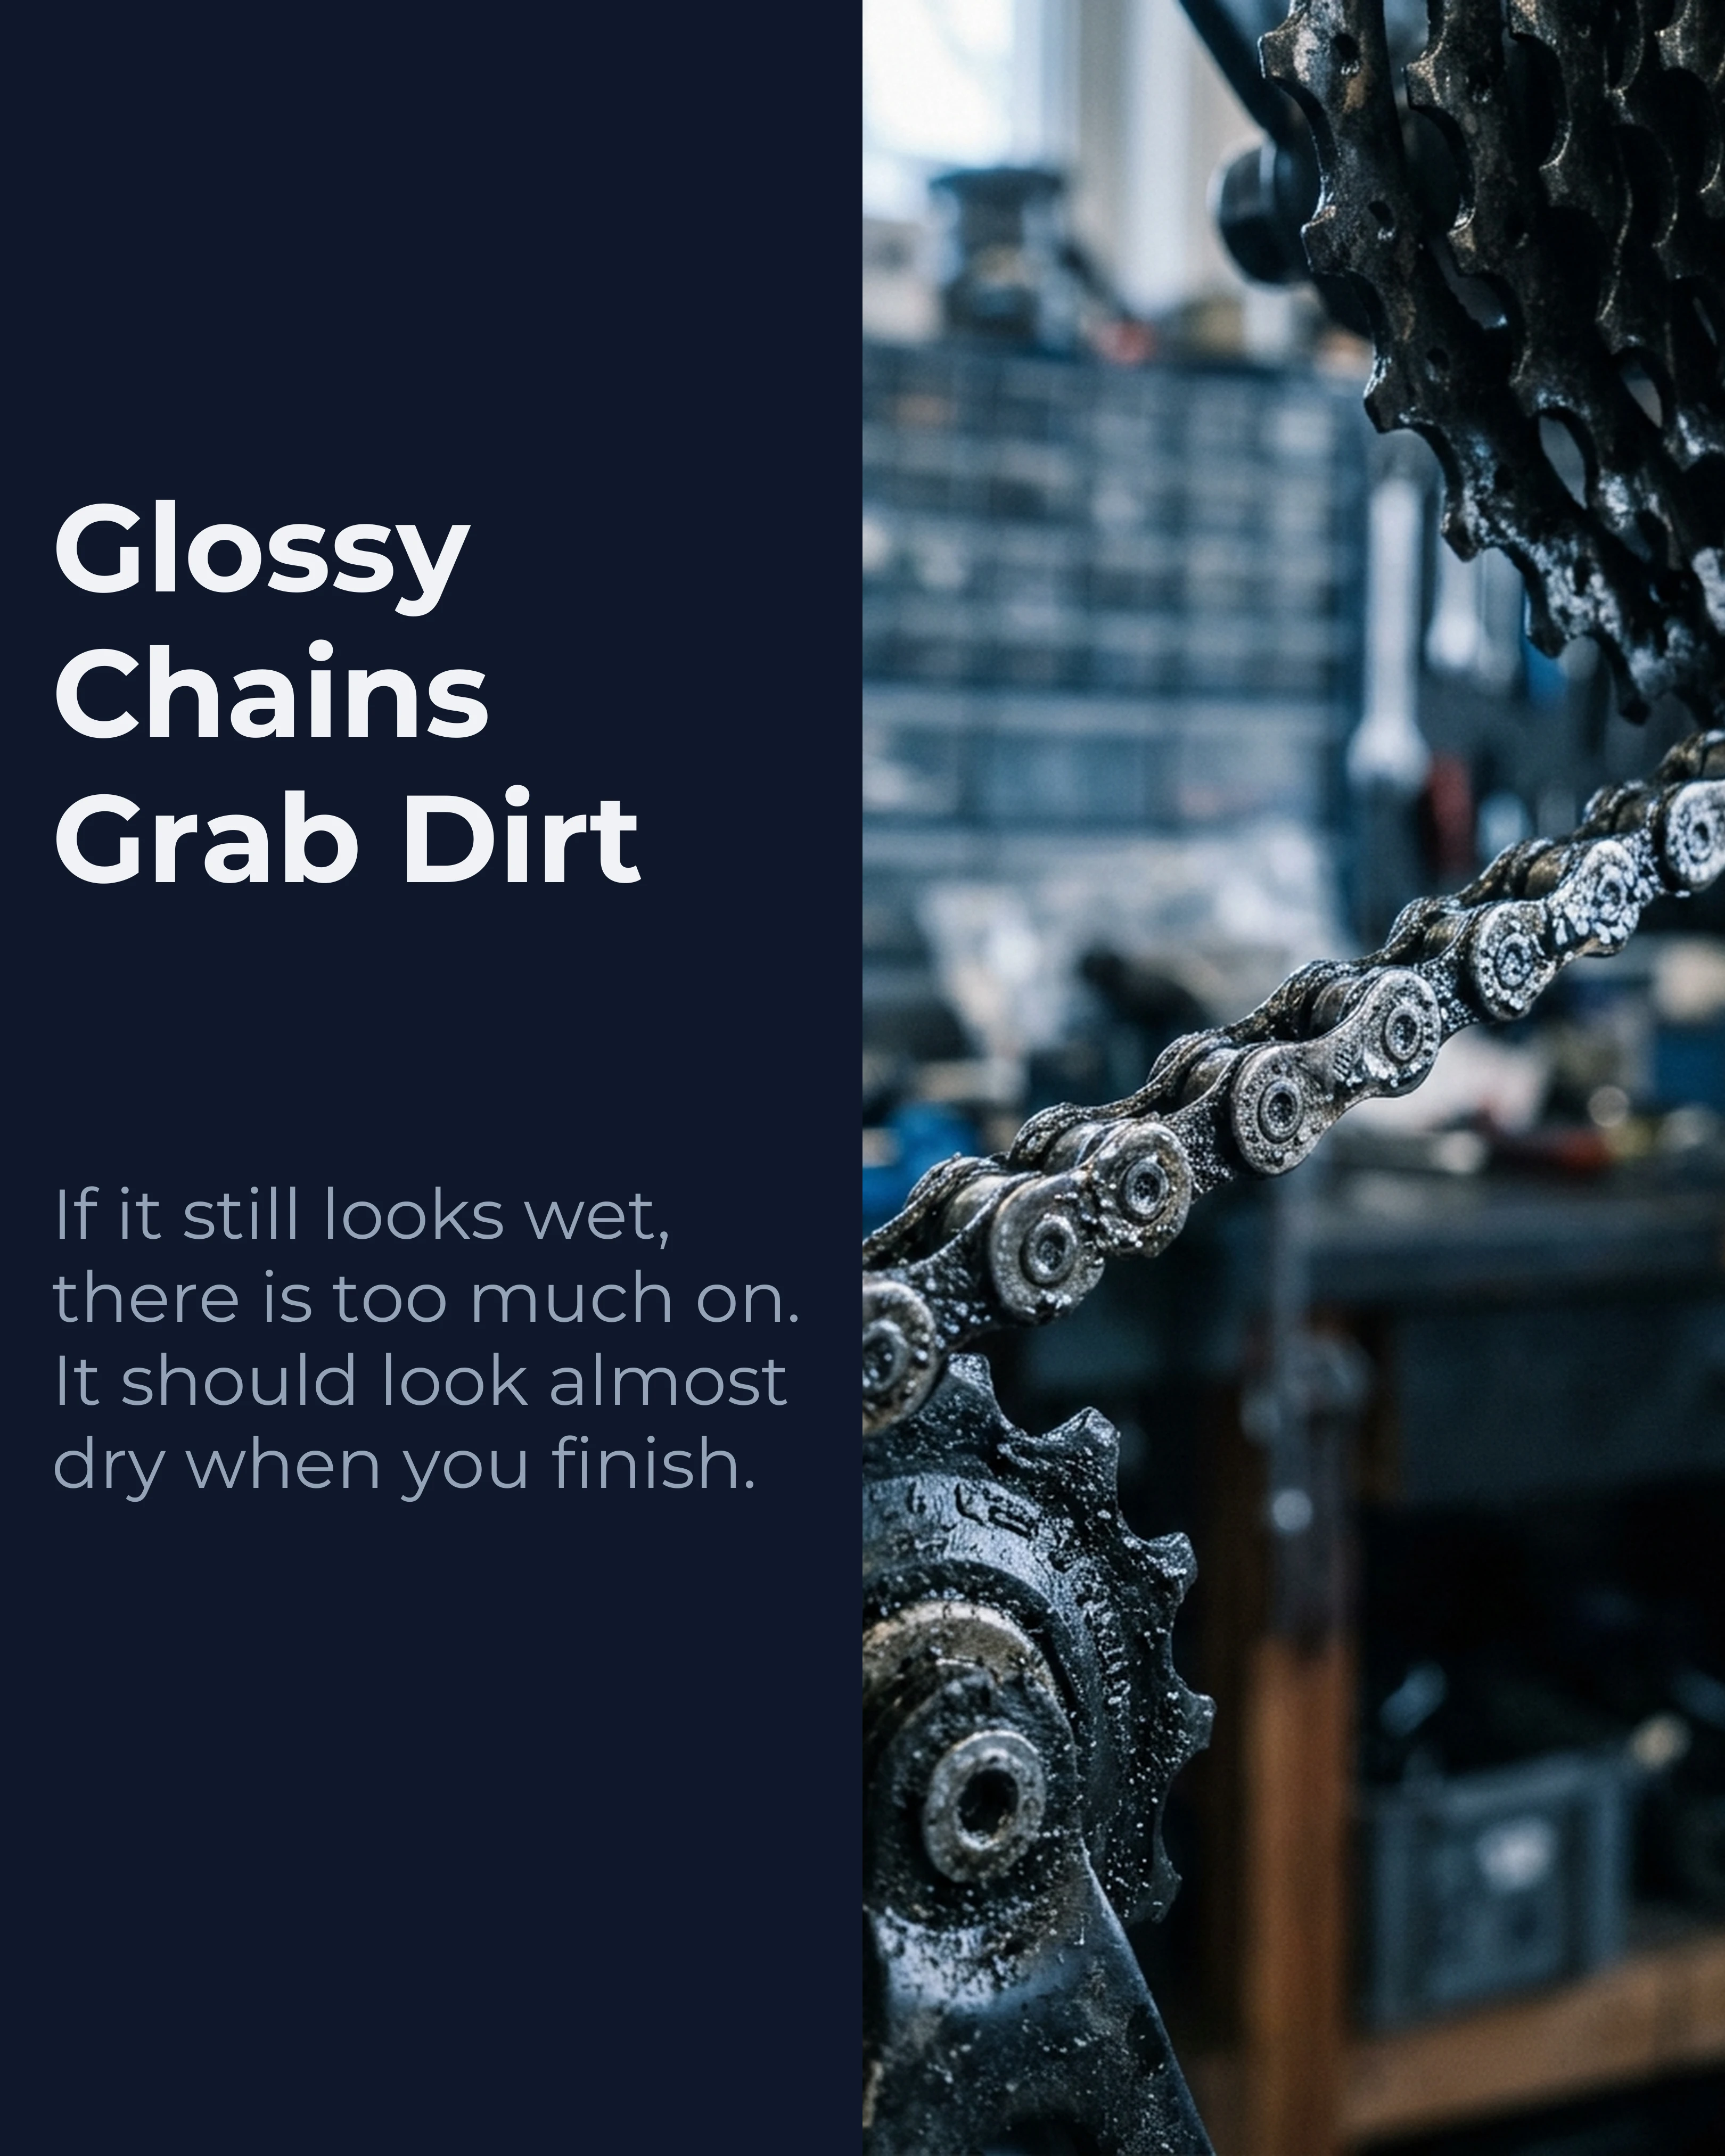
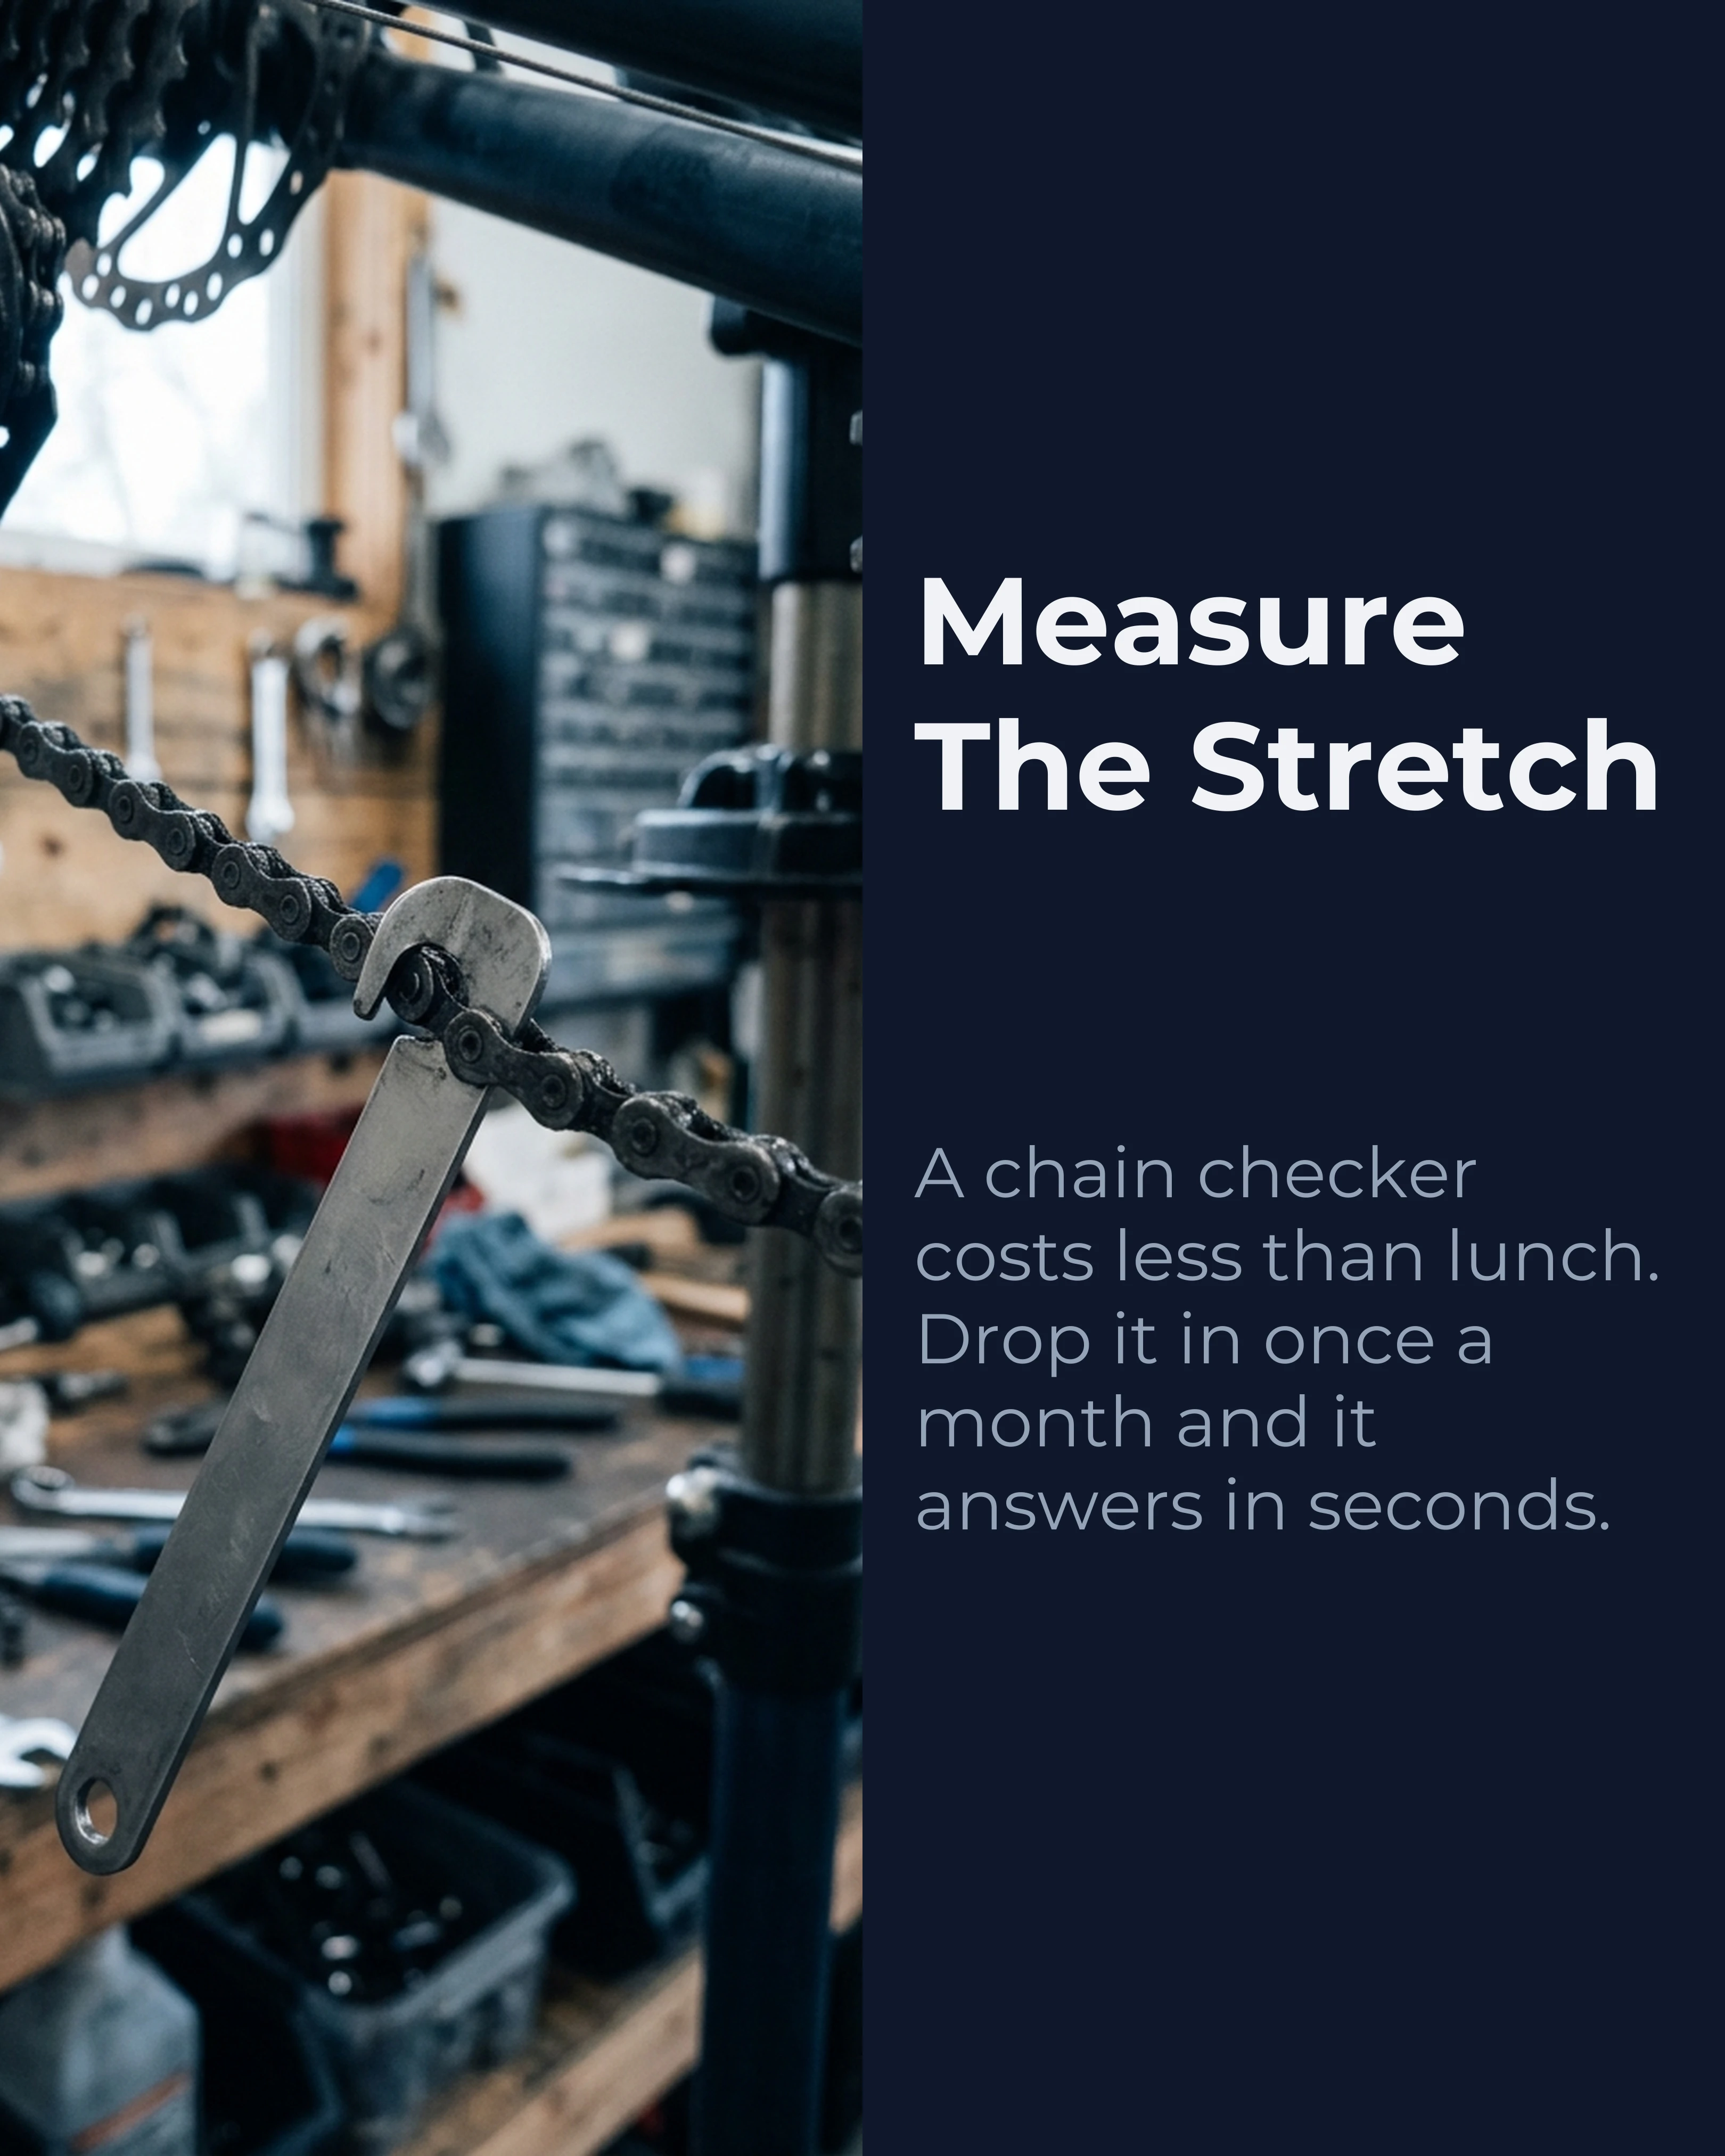
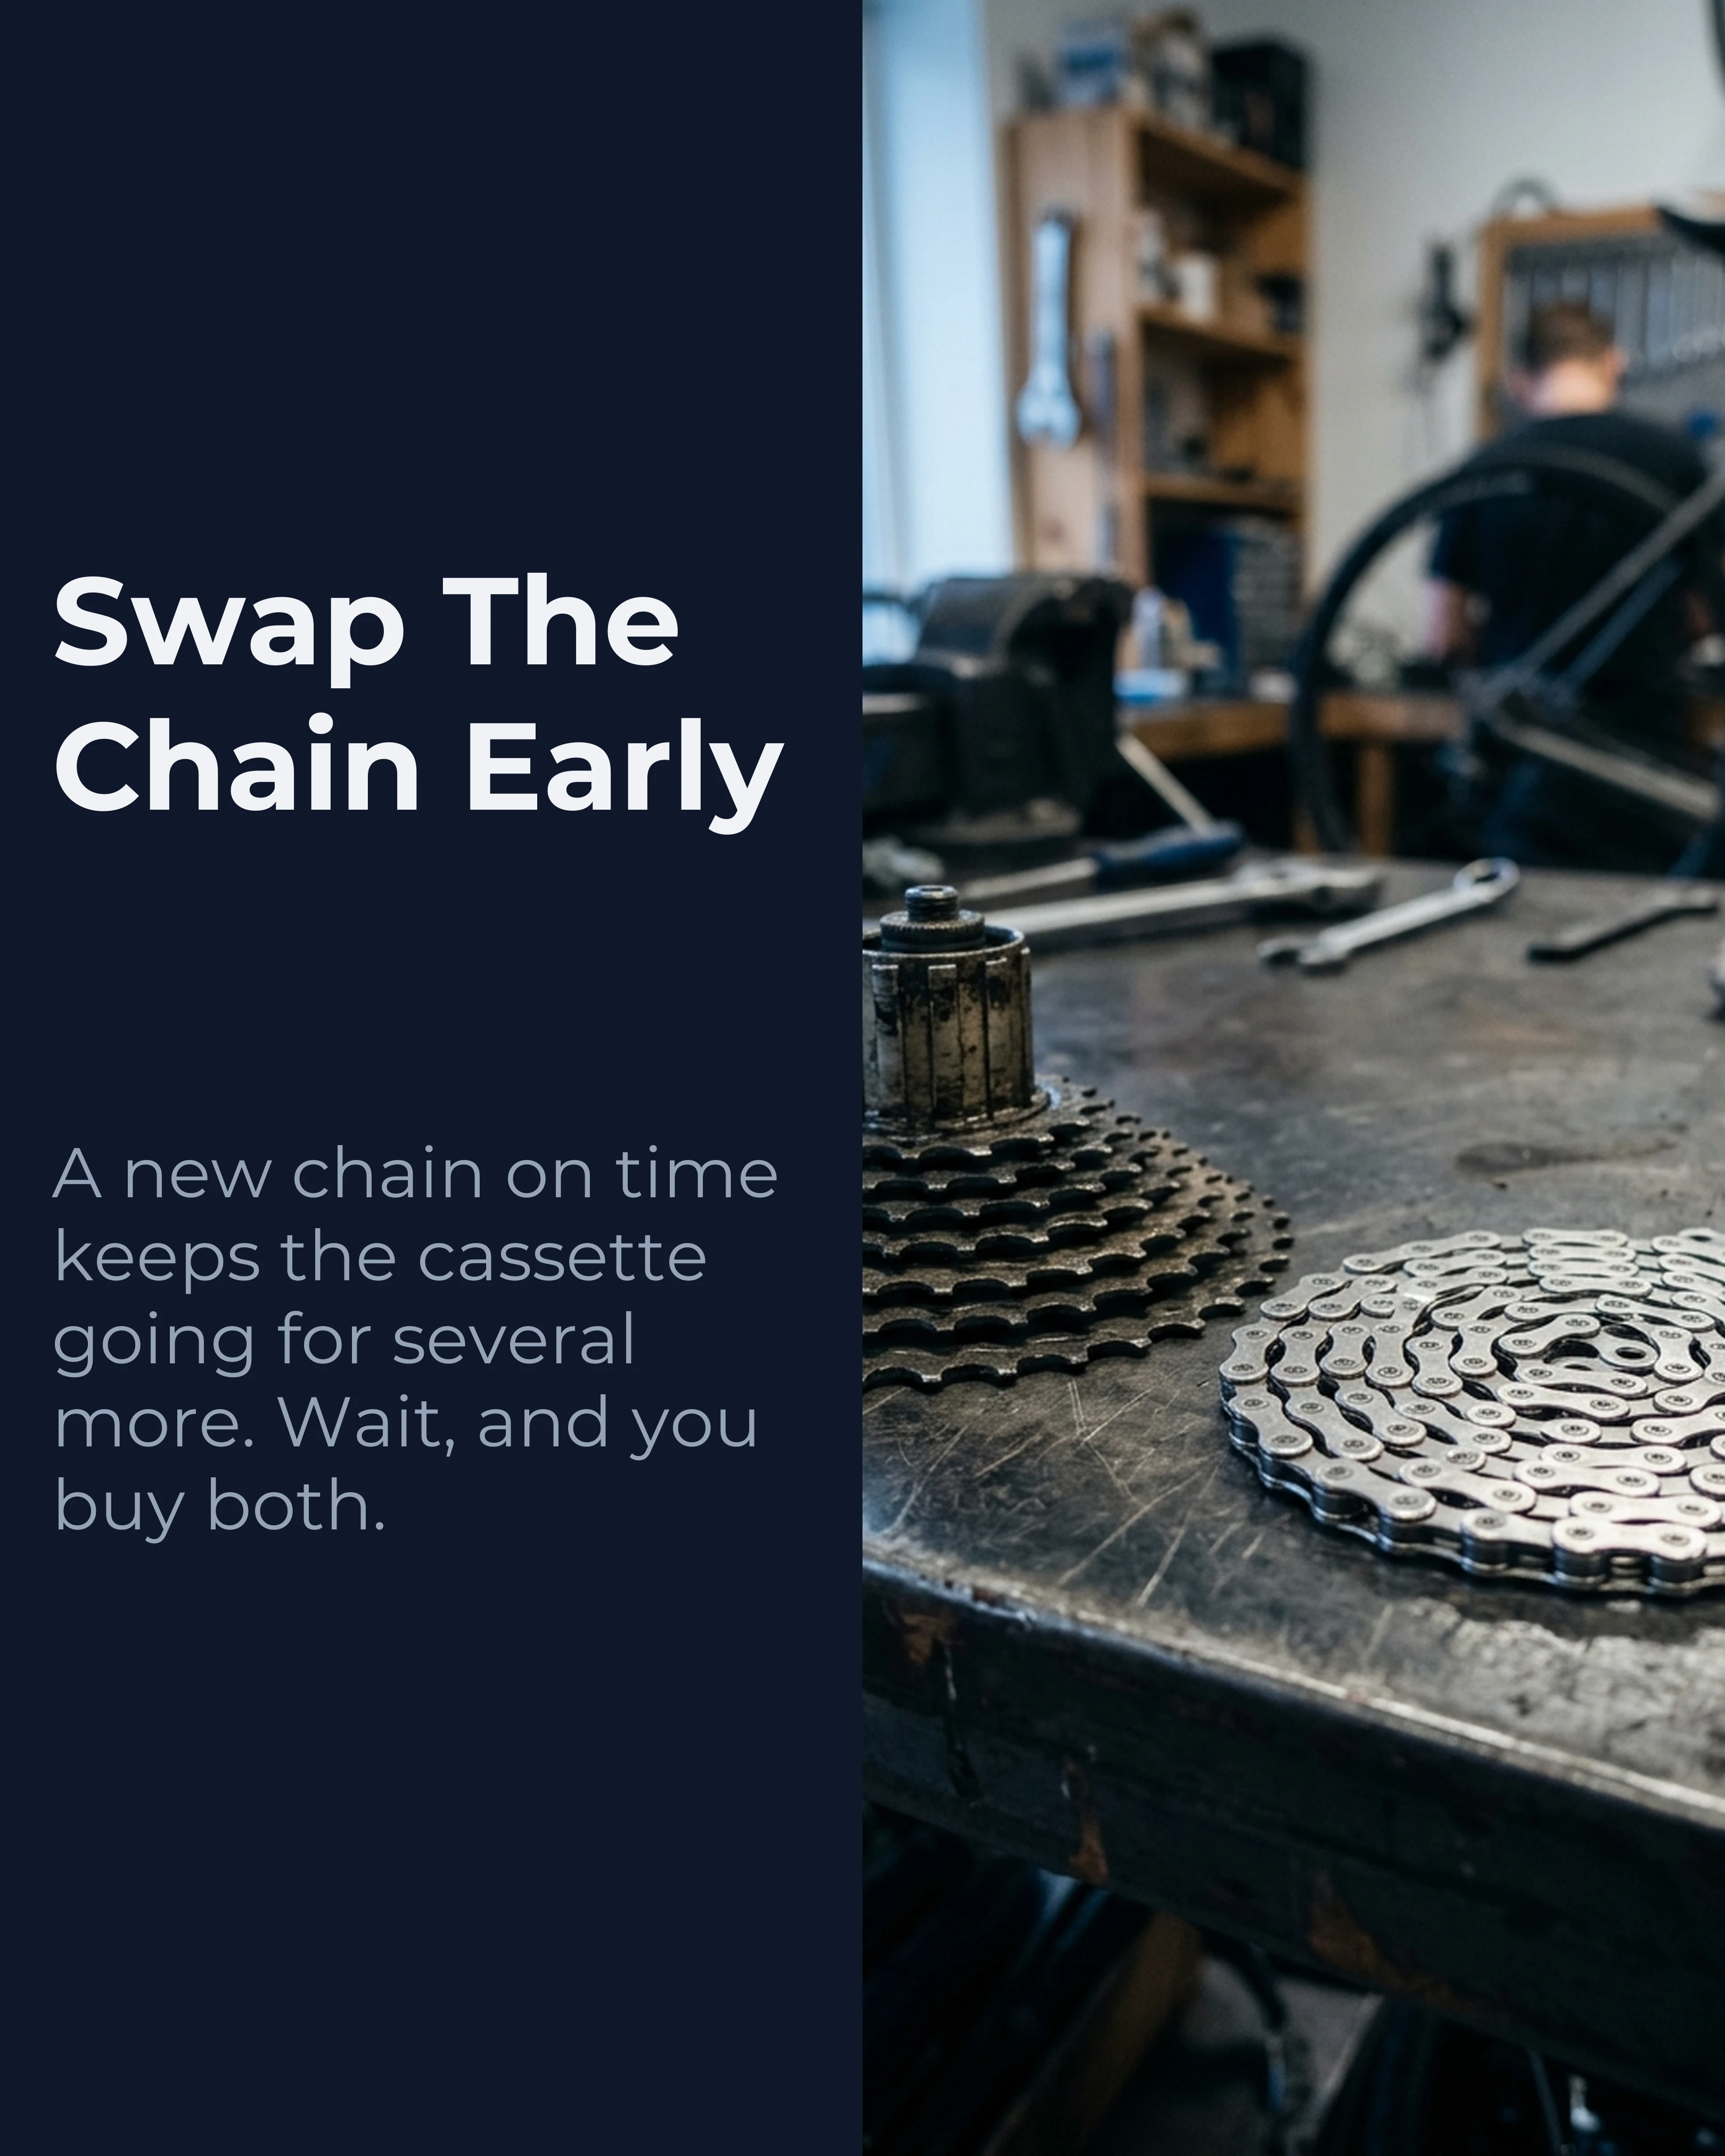
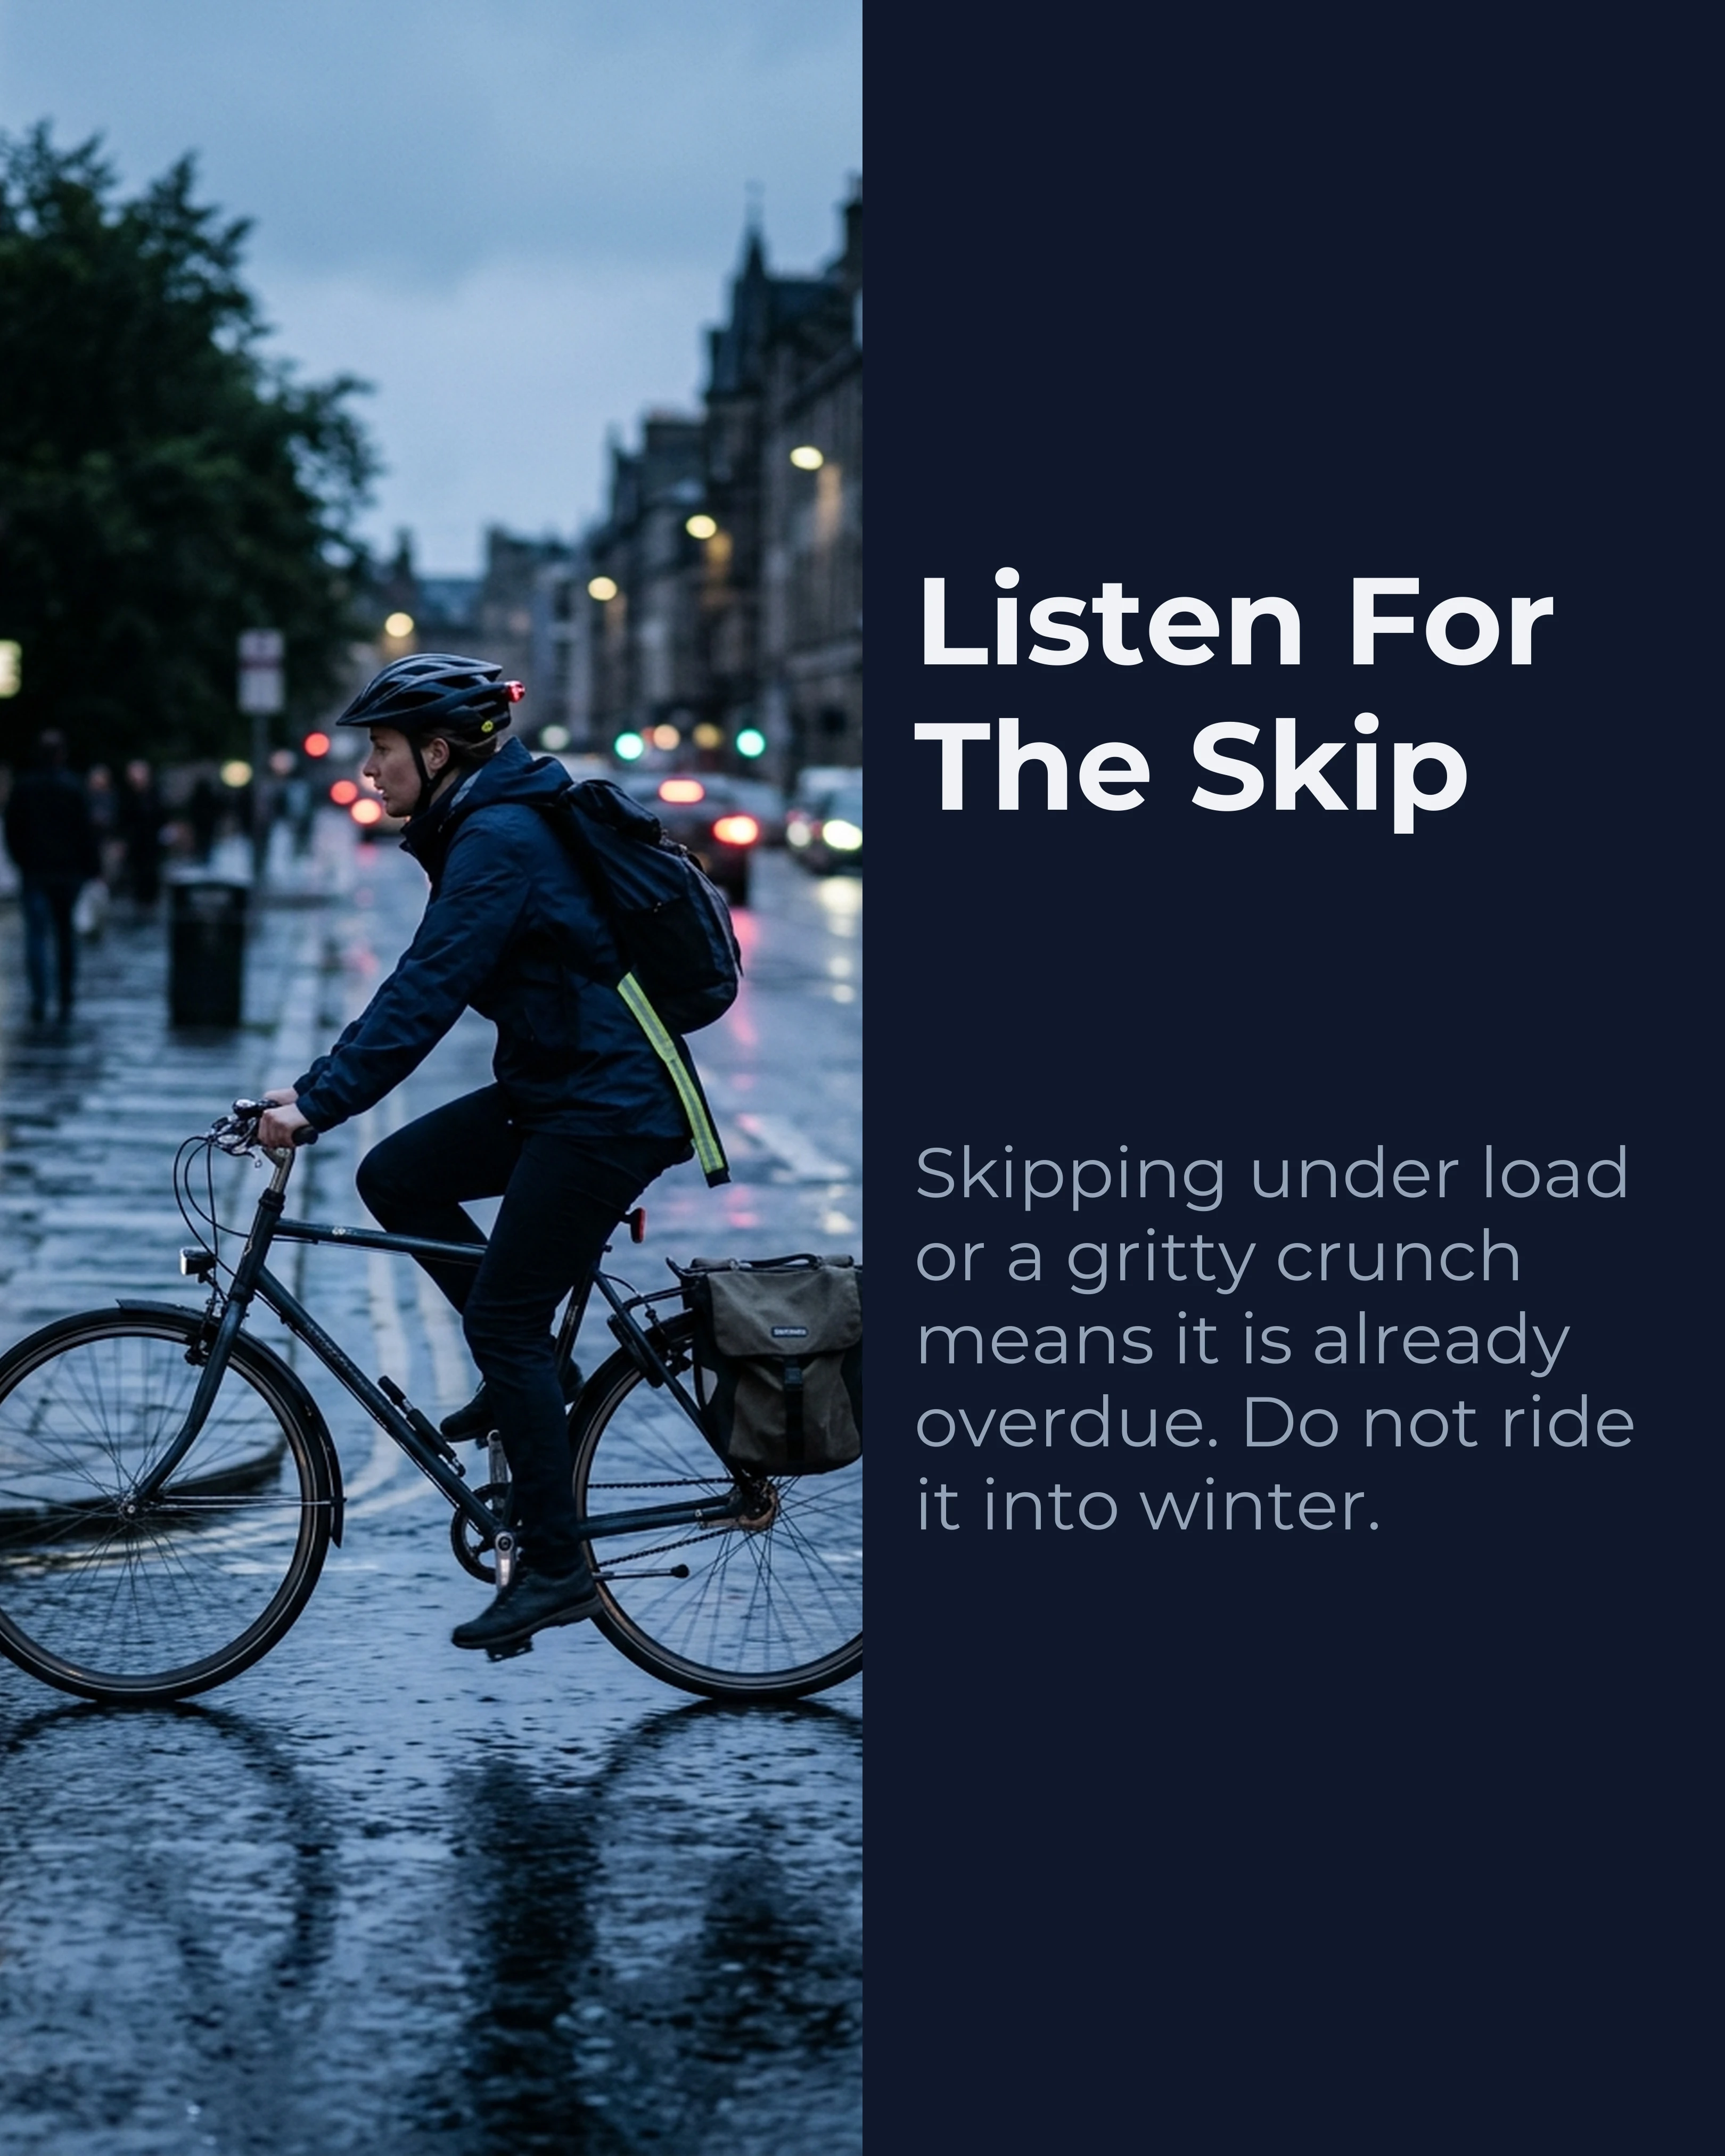

This is the one full carousel in the article; the two slides shown earlier are representative single slides from the same shop’s feed.
Look at why this post works under the odds rather than against them. It can run on Instagram, LinkedIn and TikTok with only a crop and a new caption — and Zernio found that 92% of posts go to exactly one platform, so posting in more than one place is a free extra shot at the same audience odds. Our guide to one carousel, four platforms covers how. It could go out in spring and again in autumn without rewriting a word. And it is built from workshop photos the shop takes anyway.
What to Do With This
- Reset your benchmark. Compare your posts with your own median over the last few months, not with averages from a report. Two likes is the typical Instagram post. Beating your own median is the only meaningful win.
- Stop testing posting times. Pick a slot you can keep and spend the time you save on the post itself.
- Post more often, not harder. Build a repeatable carousel series — one layout, a new subject each week — so volume is a habit rather than a push.
- Be honest about format. If raw reach on Instagram is the goal, mix in video. Use carousels where they win: engagement, LinkedIn, reference content, and anything you want to make cheaply and often.
- Reply to comments. Buffer’s strongest cross-platform finding was that posts where the account replies to comments tend to earn more engagement — an estimated 21% lift on Instagram, 30% on LinkedIn and 42% on Threads — when compared with the same account’s own baseline. Buffer is careful to say this is an association, not proof of cause, but it held on all six platforms it tested.
- Post everywhere the audience is. The same slides, resized, are extra attempts at almost no cost.
How Carousel Fits In
If volume is the lever, the bottleneck is how long each post takes. Carousel is built to make that part short: pick a template, drop in your photos, and the palette and fonts you choose carry across every slide, so a weekly series stays consistent if you reuse the same template each time. Export images for Instagram or TikTok or a PDF for LinkedIn; for a 9:16 TikTok version, start a second project at that ratio with the same copy.
Key Takeaways
- In Zernio’s 36-million-post dataset, the median Instagram post gets 2 likes, and the median LinkedIn, X and Threads post gets zero. Small numbers are normal.
- Averages are distorted by viral outliers; the top 1% of posts capture 78-90% of likes. Benchmark against medians, ideally your own.
- Posting time moved Instagram results by less than 2x across the whole day. Content and volume matter far more.
- On Instagram, per-post engagement stayed flat as posting frequency rose, while the odds of a breakout post rose sharply.
- Reels beat non-Reel posts at the median on Instagram, and get 36% more reach than carousels in Buffer’s data. Carousels earn 12% more engagement and dominate LinkedIn at a 21.77% median engagement rate.
- Carousels win on engagement, LinkedIn, scarcity and cost to produce. Use them for evergreen, save-worthy content you can publish often and cross-post everywhere.
Ready to make your weekly series quicker to produce? Download Carousel — free on the App Store.
Create your first carousel in 60 seconds — free
Pick a template, paste your text, export. It's that simple. No design skills needed.
Download Carousel